All blogs

Automated Site Auditing with Drutiny
Site auditing modules in Drupal need to be installed in the codebase and require certain modules to be present on the server for gathering the required metrics. Moreover, traditional site auditing tools cannot be customized. In this blog post, we will be exploring Drutiny, an open-source Symfony Console based application used to audit Drupal 7 or Drupal 8 sites.
What is Drunity?
Drutiny stands for Drupal and Scrutiny. It offers an automation layer for auditing and reporting the Drupal 7 and 8 sites with a library of predefined policies. All checks are run from the outside looking in and require no special code or modules to be enabled on the remote site. This means you can audit all environments from development to production and not have any lasting performance degradation.
Why Drutiny?
- With traditional Drupal modules like Checklist API and the Security Review module, we need to deploy the code to the server or enable the module on the site and if you fail to enable the module, then no auditing will take place.
- Other extensions like (site_audit Drush extension) are limited to running only Drush based checks and you cannot customise the checks.
Benefits of Drutiny
Drutiny does all the checks from the outside, which means that we don’t need to run the code or enable the module on the remote site or server.
1. You can audit all the environments from development to production and there will be no performance degradation as it will not put the load on the server
2. Drutiny also integrates seamlessly with the other tools to ensure that you have maximum flexibility when it comes to running checks, e.g.
- Drush (e.g. check the status of a module, or get a variable value)
- SSH (e.g. filesystem checks, directory size checks)
- Phantomas (e.g. check the actual rendering of the site and ensure there are no in-page 404s)
3. You can run site audits against Drupal 7 or Drupal 8 sites using the same Drutiny codebase
4. It ensures the site state against performance and security best practices
5. It offers automation of sanity testing
6. Different types of report formats are available with Drutiny
Installation of Drutiny
Step 1: Drutiny can be installed in 2 ways:
In your project folder using composer - Add the composer dependency.
OR
As a standalone tool - Clone the Drutiny framework using composer
Note: We are using a standalone tool installation approach in this blog.
Step 2: Installing Drush for getting Drush aliases
The version of Drush to be used will depend on the site you're auditing. For instance, Drush 8 is recommended for D7 and D8 sites.
Step 3: Test the Drutiny installation
- If using Drutiny inside the project folder: Run the following command from the composer vendor bin directory
- If using Drutiny as a standalone tool
Step 4: Download Drush Aliases from Acquia Cloud (Optional)
Download the Drush 8 aliases for all of your sites and extract the archive into $HOME
This folder will contain two hidden folders named .acquia and .drush. Both of these folders should be placed in the $HOME directory on your system. The .acquia folder contains your Acquia Cloud API credentials and the .drush folder contains your Drush aliases for the sites you currently have access to on Acquia Cloud.
Note: Step 4 is only useful to get site aliases for the multiple sites on the Acquia cloud.
How to use Drutiny
When you're running Drutiny as a standalone tool use this basic command

Drutiny works with Policies and Profiles. These are the key elements of Drutiny.
Policy
Policies are structured YAML files that provide the human-readable context for an audit. You can see the predefined list of policies with the policy:list command.
Syntax:
Example: If you want to make sure that user # 1 is locked down, Cron is running, JS aggregation, Certain Modules are enabled or disabled.

What does a policy do?
You can view the policy details using thepolicy:info command and just pass the policy name.
Syntax:

Auditing a Policy
The user can run the single policy audit against a site using policy:auditcommand where policy is the name of the policy to run and the target is the Drush site alias.
Syntax:
Examples
- Audit a site for anonymous sessions via Drush

- Specifying a URL
In multisite scenarios, you will need to specify which site to connect to via a --uri option.

- Customize policy parameters
A policy may contain parameters that can be customised at the time of execution. To know what parameters are available, use the policy:info command

In this policy, the max_size and warning_size parameters can be specified. These parameters can be passed in at runtime like this:
Profile
Profiles are a collection of policies that audit a target against a specific context or purpose. Examples of the profile are Production-ready Drupal 8 site and Security or performance audit.
To view the list of available profiles in Drutiny, use the command profile:list
Syntax:

What does a profile do?
To know which policies are included in the profile, use the command called profile:info
Syntax:

Running a profile audit
The profile:run command allows you to run a profile against the target
Syntax:


Building a custom profile
The user can create a profile that is specific to their internal guidelines with the desired policies. Profiles are YAML files with a file extension of .profile.yml. To create a profile, use the command called profile:generate
Syntax:
The Drutiny will prompt you for the mandatory fields such as profile title, brief description about the profile, policies to be added in the profile and the file location.

And further, you can use your custom profile in the same way as built-in profiles.
Reports
Drutiny allows the use of 3 types of reporting formats:
- CLI
- HTML
- JSON
If you do not specify any report format, the CLI format will be used by default.
You can use the following parameters for the reports:
- -f parameter to write the format of the report
- -o parameter to specify where to store the report.
Syntax:

Open the HTML report in your browser to view the report. From there you can also print it to PDF. Refer to the report attached in the image below.

Conclusion
- The Drutiny is a very flexible tool as we can customize the policies, profiles and HTML reports and it also has support for other tools
- It is a highly useful tool when we want to support a lot of sites in the long term
- It allows business and product owners to check the existing automated reports, thereby helping them improve the site
- It is also helpful to technical leads to improve team processes and standardise site builds within the team
- It can also save development time and avoid mistakes when used before launching the sites
Happy Testing!

How to handle multiple windows with Selenium 4
Opening an URL in a new window or new tab is one of the features provided by Selenium 4. In Selenium 3, we can achieve this by performing switch operation using the WindowHandle method. In Selenium 4, this is going to change by using the new API newWindow.
So why do we need to create a new tab/window?
Let’s consider a test scenario where you have two interfaces, one for admin and another for users. As a user, you need to perform some steps then you have to log in as an admin. As an admin, if you do some configuration changes, these changes should be visible to the user. In such cases, we can open the website in one window and log in as a user. Then we can open the same website in another window and log in as an admin. Once the admin performs the configuration changes, we can go back to the user window and verify whether the changes are reflected.
How to handle the new tab/window in Selenium 4?
Selenium 3 vs Selenium 4
In Selenium 3, we needed to create a new WebDriver object and then switch to a new tab or window. But with Selenium 4, we can avoid creating new WebDriver objects and directly switch to the required window. We have a new API called newWindow in Selenium 4. This API creates a new tab/window and automatically switches to it.
New Tab
Here’s how you can create a new tab in Selenium 4 and switch to it:
Let’s consider that you are on the QED42 homepage and you need to switch to another URL in a new tab.
Here is the snippet to open an URL in the new tab:
New Window
Creating a new window in Selenium 4 and switching to it:
Similar to a new tab, here is the snippet to open an URL in the new window:
Switching back to the Original Window
Suppose, there are multiple tabs and windows open and you need to switch to a particular or original window/tab. This can be achieved using driver.switchTo().window(windowHandle) method.
Let’s implement the below steps to understand it:
- Load QED42 homepage using driver.get("https://www.qed42.com/")
- Open a new tab and load the other URL "https://www.google.com/"
- Next, open a new window and load "https://www.facebook.com/"
- Switch to the original window (step #1) by looping the windowhandles based on certain conditions and selecting the original window handle.
- Close the driver.
Below is the console output:

Point to note: Closing a window will leave WebDriver executing on the closed page and will trigger a No Such Window Exception. Therefore, you must switch back to a valid window handle in order to continue execution.
The sample codes are available at the Github repository here.
Conclusion
Selenium 4 provides better window/tab handling using a new API. We can now create a new tab/window and automatically switch to it with fewer lines of code and without creating a new WebDriver object.

Cypress timeout – uncovering website performance issues
We were working on building a site that was a bridge between interested customers and the car dealers/OEMs. All the data related to a vehicle which will be useful for a customer was displayed on the website. The data from interested buyers was also captured through a form and shared with the relevant dealers/OEMs.
As the project was growing day by day, new features were getting added. So, manual regression testing was becoming a lengthy process before every release which happened twice a week.
The website was on ReactJS. We were using Cypress for automation because it is purely based on JavaScript and uses a unique DOM manipulation technique and operates directly in the browser. Cypress also provides a unique interactive test runner in which it executes all commands. We started automating the regression test cases according to the priority of the module. The regression suite was integrated with CI. Before every release, it was mandatory for the regression suite to pass in the CI.
Problem Statement
There were two releases in a week, which meant that new features were added every time. Suddenly we started facing issues on CI and test cases started failing randomly with timeout errors.
We tried running it multiple times but test cases that were passed earlier start failing, on every run we were seeing various sets of test cases failing which were passing before, the result was not the same in every run.
We suspected that there was some issue with the Cypress tests, so we tried to replicate the issue on our local machine. But many test cases randomly started giving timeout errors on our local machines as well.
What is a timeout?
All the commands in Cypress have a default timeout that means Cypress will wait for a definite time for the command to get executed, all the DOM-based commands have a default timeout of 4 seconds.

For example cy.get(‘#firstname’), in this case Cypress waits up to 4 seconds for id to be present in DOM. Similarly for every assert command Cypress waits up to 4 seconds by default. It looks for the element up to 4 seconds and if it is not present, Cypress throws an error 'Timed out retrying after 4000ms: Expected to find element: #firstname, but never found it'.
So the conclusion was that our Cypress test suite failed due to the timeout issues. When testing a web application, a timeout error can occur when the application performs an asynchronous operation that needs to finish before the application state and user interface (UI) are ready for testing. If a command or assertion in Cypress is executed before this operation completes, the test will mostly fail.
However, if the time taken by this operation varies, sometimes it may complete quickly enough to pass the test. This inconsistency creates a situation where the test results become unreliable or "flaky."
Our Solutions
On looking at the timeout errors, our first approach was to increase the default timeout to 20 seconds, just to check if the test cases started passing. Yes, all the test cases started passing after we increased the default timeout.
How did we decide the timeout for our application?
Now, the next question was what should be the value of default timeout? We thought of checking the performance of our website. We found that the average time taken by all the pages to be interactive was around 8.5 seconds.

When we increased the default timeout to 10 seconds in cypress.json our test cases started working on CI.
1. Specifying timeouts:
We can modify the default timeout for a single command by passing a timeout parameter, for the example in this contact form , if we want to add a 10 seconds timeout we can modify it as below:
Here in the above code we have given different timeouts for each command, so cypress will wait for the wait for a given time (only if an element is not found) before moving to the next command.
We can also globally configure by setting these timeouts in cypress,json which will by default add a 10-second timeout for all the commands.
2. cy.wait() function
Lets understand cy.wait() , this will wait for specified milliseconds or wait for an aliased resource to complete to move forward . Here we can specify the time period. If needed this is simple way to specify wait time Example for 5 seconds
- Request timeout : Default Request Timeout is 5000 ms . This means that cypress by default will wait for 5000ms for a matching request to leave the browser . If no matching request is found , cypress will throw an error.
- Response timeout : This is the second wait period which is 30 secs by default. After cypress affirms matching requests being sent, it waits for the response for this request . if there is no response from the external server , an error is thrown.
In the example above:
- We first perform an action, such as clicking a button, which triggers an asynchronous operation.
- Then, we use .invoke('text').as('resultText') to assign the text value of an element with the class .result to the alias resultText.
- We use cy.wait('@resultText') to wait for the alias resultText to have a specific value. In this case, we expect it to be 'Expected Value'.
- Once the alias value matches the expected value, the test proceeds to the next step, where we can continue with other assertions or actions.
By using cy.wait() with an alias, you can ensure that Cypress waits for a specific condition before moving on to the next steps in your test. This is useful when dealing with asynchronous operations and waiting for certain values to be available or updated.
Conclusion
We were continuously adding new features to the site, due to which performance of the site was impacted, and our Cypress tests started failing because the time required for rendering the elements on the pages was high. The real issue was with the performance of the page. These reports were shared with the development team and it was decided to improve the performance of the websites in the next sprints.
It's not always that your test needs to be fixed. We need to identify the root cause and provide feedback to the team.

Mobile App Performance Testing: What, Why, and How?
With almost 3.5 million smartphone users, it is no surprise that the mobile application industry is flying high. App usage and smartphone penetration are growing at an exponential rate. If you take a minute and look around, you will find that almost everyone is glued to their screens. We use our phones while at work, at home, lying down in bed, and even while eating. A pertinent question to ask would be: what exactly do we do on our phones?
Most people use applications on their phones, which exponentially increases with the time they spend on their mobiles. There are over 3.48 million apps available on Google Play Store. According to recent studies, millennials have around 35 to 40 apps on their phones, out of which they spend time on approximately 18 of them.
Since many apps get developed every day, testing these apps is crucial. If an app has a glitch before it gets launched in the market, that error needs to be corrected. Mobile app testing ensures that the apps get tested for functionality, consistency, and usability. However, performance and speed are also vital factors that are checked before launching an app.
What is mobile app performance testing?
Every app goes through a performance test. A performance test is different from a functionality test. A functionality test determines whether the app is responding correctly or not. A performance test determines the various other aspects of the app, like its speed.
Performance testing is vital since it establishes the durability of an app over multiple areas. QA engineers simulate real-life usage environments to run these tests. It helps them to experience for themselves what a user will feel while using the application. This is the prime difference between functionality testing and performance testing.
Mobile app performance testing determines various arenas like speed, user-friendliness, volume testing, scalability, usability testing, load testing, stress testing, etc. When the application goes through performance testing, it is crucial to ensure that the app works according to SLA (Service Level Agreement). SLA is a written agreement that specifies the service committed by a vendor to its user in terms of quality and quantity. The test should also ensure that the app will work even at the time of low connectivity.
The overall process of mobile app performance testing includes:
- Connectivity test: Most applications require an online connection. The application developers will have to ensure that the app is functional even without an online connection.
- Location stimulator: For a GPS-specific app, the test needs to determine that the app does not change drastically when the location changes. It is a crucial test.
- Security testing: While using an app, most applications collect the data from the device and store it on the server. The performance test has to ensure that the data in its server is safe and confidential.
Why do we need mobile app performance testing?
Mobile performance application tests determine the application's overall performance, which is a big part of your business. A performance test helps to determine the application's working in unfavorable conditions like low network strength, sharing resources with multiple applications, etc.
An app is created with a purpose to fulfil some desire of its user. For example, apps like Facebook, Instagram, and Snapchat connect users from across the world. Apps like Zomato and Swiggy help users order food; Weather or Forecast offers information about the weather. To ensure that an app perfectly performs its functions, a mobile app performance test is crucial. Sometimes when an app performs poorly, most of its customers never use it again.
A study found that 9 out of 10 times users stopped using a particular app because it responded poorly.
Therefore, it becomes vital to test an app before launching it.
Let us understand this with another example. Consider two companies, A and B, that are new in the market. Their prime business takes place through their online protocol and apps. Both the companies deal in styling products. Both company's apps are user-friendly, but company A's app does not work efficiently when connected to a slower network or changes drastically when the location of the user changes. Because of these glitches, company A is losing its customers, and company B is gaining an advantage. It will drastically affect the business of company A.
To avoid such hurdles in your business and promote growth, a mobile app performance test is indispensable.
Performance metrics for mobile applications
Every app that gets measured can improve as well. There is always room for improvement. An app has to go through many levels of testing, modifications, and re-testing to become high quality. To assess the standard of apps, we must first understand the different performance metrics.
- Crash rate: Anyone who has used an app has at least once experienced a crash. The crash rate gets calculated as a count of the number of app launches divided by the number of crashes in the same period. The ideal crash rate varies from 1–2%, but this varies from app to app depending on its usage, maturity, etc.
- Average response time: The app's average response time is the time it takes to load and open in the smartphone. The average response time should not be more than 3–4 seconds, as users tend to delete the application if the app's response time is more.
- Maximum response time: When a command gets placed on the application, it should not take more than a second to respond. A significant response time will lead to the app being labeled as inefficient.
- Network errors: Sometimes, network connectivity may not be ideal, like a poor network or HTTP problem, which may lead to the slow response of the app.
- Throughput and latency at peak load: Throughput is the number of requests that an app can handle in a time frame. While designing the app, the developer should know about the number of requests an app can respond to in a minute. Peak load is the time frame in which there are multiple requests. The app gets designed using various threads to handle such situations.
Challenges in mobile app performance testing
Testing a mobile app can be very challenging. While undergoing performance tests, many issues arise related to the load, speed, response time, etc. A few of these challenges are listed below:
- Setting up a real-life environment: Sometimes, the parameters set for the performance test do not match the real-life scenarios, thus leading to misleading results. The app testers should ensure that the parameters are realistic and can occur while using the app.
- Device variety: Since there are many different versions of devices, the app should perform equally well in all of them. Many users and appliances should be brought in at the time of testing to ensure more significant results. Gathering these devices can sometimes be a tricky affair.
- Touchscreen: With all smartphones converting into touchscreen format, this can be a hindrance. The signs used as a data entry can pose a challenge while performing the test. The testing of touchscreens needs to be stable and intricate.
- Increasing device features: With the increase in device features, sometimes the app may not respond well. The components in newer devices are becoming more complex day by day. It is essential to understand these complexities to ensure that the performance test results are optimum.
- User interface: With so many devices in the market, the app's user interface may also vary according to the different operating systems in the machines. To avoid this, the app should be used beforehand to check its display.
- Lesser time-to-market: The main aim of developing the app is to present it to the market. The general time taken to launch an application in the market starts within 20 days of its incorporation. Hence, the performance test must be done from the very beginning to avoid any hindrance.
Planning and strategy
Planning and forming a good strategy for the performance test is a very crucial step. Creating a fool-proof strategy plan from scratch can be difficult. But the good news here is that testers and developers can examine existing performance test samples.
These are the steps required for planning:
- Aligning test objectives and business requirements: Before testing, the company will have to set its goals. Make sure your goals are aligned with the app's functions. While selecting the objective of each case, ensure it corresponds to the business goals. It is the stage in which the testing team gets an overall view of the product.
- Identify test KPIs: By setting benchmarks or KPIs (key performance indicators) for each profile of the performance test, the app can be made more efficient. Putting maximum response time, peak load, average response time, etc., will help determine the true worth of the application.
- Finalizing tools and methodologies: Before getting on with the test, the tester will have to determine what tools and methods should be applied to get the desired results.
- Prioritize scenarios: Do not test all the features of the app in one go. Select the elements according to priority. First, try the opening feature of the app. If the results are positive, dive into more complex commands and codes and analyze them.
- Real-life testing: Sometimes, the performance test is based on irrational scenarios. The results generated in such cases can be considered efficient. Try to create real-life scenarios so that it is certain that the app can perform effectively.
- Carrier network: All apps work on internet services. Keep in mind that the internet connection to devices is through third-party carriers. Therefore, the latency and connectivity may vary. The QA specialist should keep this in mind while determining the app's optimization and improving user experience.
Factors affecting mobile app performance
There can be various factors affecting the performance of a mobile app, such as:
- Device – client-side: Different devices have different operating systems that display certain apps in a certain way. User interference, screen touch, RAM, etc., are also reasons why a specific app looks different. Therefore, different devices should be taken into consideration while performing tests.
- Backend/API: When an app uses APIs to connect to the servers, the response time becomes crucial. Various factors can affect the response time, like network issues, API calls generated from the app.
- Network performance: The network glitch can also cause a factor affecting the version of the mobile app. Some users might use 2G/3G or experience low network connectivity. Even in such instances, the app should yield optimum results.
Best tools and frameworks
- Neoload: Neoload is a unique tool that helps in creating realistic performance tests for mobile applications. It helps create a test that accurately considers real-life scenarios like network issues, different devices, and different locations. Neoload can also be integrated with Perfecto, Appium, and more.
- JMeter: JMeter is a Java-based application. It measures the performance of various web servers. JMeter allows you to undertake numerous tests, ranging from performance and speed to the time taken to load, to determine the actual efficiency of the product. For the mobile application test, JMeter uses a proxy server. The proxy can get configured on any device; JMeter will capture the request.
- Selendroid: Developers and testers can use Selendroid to determine any bugs or glitches before going live. Selendroid is also used to determine the power consumption and the frequency of app crashes. This tool also maps down the bug reports and generates performance metrics after each test.
- Eggplant: Eggplant enables businesses to test any platform or app through AI and machine learning. It provides sophisticated performance and load-testing tools that can test a wide range of technology.
Conclusion
To ensure that the app is indeed useful and delivers its intended result, mobile app performance testing is a necessary step. Mobile app performance test helps to check various metrics such as average crash time, the response time of the app, network errors. It also helps in finding solutions to these problems. For a business, this is an essential step since its credibility lies in the app. The scale of growth and revenue of the company also depends upon this. If the app performs well, it ensures more downloads, recommendations, and popularity, leading to booming business. When developing a performance test, the developer has to carefully take into consideration all the necessary fields such as different devices, identify the key performance factors, prioritize scenarios. Planning and strategizing are very crucial. We believe in the deep integration and testing of an application to provide the best possible stability and performance. With our end-to-end quality assurance and testing services, we promise to deliver error-free and high-performing mobile apps. To know more about our quality assurance services click here.

Role of QA in Sprint Zero
Sprint Zero is officially not a part of the agile methodology, but it is a pre-planning process for a project. It usually takes place before the formal start of a project. The goal of Sprint Zero for the development team to come together and begin the project exploration. The quality of any project is crucial and should start from the very beginning. And hence it is imperative that your QA team should also be a part of Sprint Zero.
As per STLC (Software Testing Life Cycle), testing starts with the first phase called requirement gathering and analysis. QA engineers can deliver a quality product when involved in this first and very important phase, from where the testing starts. The main focus is to carry out testing as early as possible because as we know finding and fixing the defects in earlier stages of the project is recommended. And thus, QA engineers must participate in Sprint Zero.
Let’s look at the QA activities that can be undertaken in Sprint Zero
Requirement analysis:
- QA engineers can participate in requirement gathering calls with product owner/s to gather product knowledge and the focus area.
- They can use different methods to gather the requirements such as walkthrough, review or inspection.
- QA engineers can find out the unclear or missing or ambiguous requirements or design discrepancies from the planned result and recommend improvements (flow wise).
- QA engineers can not only verify the requirement but also validate the requirements for correctness before the requirements are baselined/frozen.
Test planning:
- QA engineers can prepare the test plan with the attributes like scope of testing, strategy, usage of tools, feature to be tested, entry and exit criteria, risk mitigation and contingency plan.
- QA engineers can perform an initial quality risk analysis by risk identification and assessment.
- QA engineers can also definitely do a feasibility study against estimating the testing effort and resources/tools needed.
Test design:
- QA engineers can consolidate the requirement by identifying the testable requirement and start preparing test cases (maybe starting with basic functionalities) and create an RTM (Requirement Traceability Matrix).
- They can also help to write the acceptance criteria of a user story for Sprint 1 and subsequently do the same at the starting of a new Sprint when QA work is a little less which will help to get approved your user stories by the PO and further help to validate the assumptions.
- QA engineers can specify the definition of "done".
Requirement analysis for automation testing:
- With respect to automation, QA engineers can recognise if and when test automation is required.
Requirement planning for automation testing:
- QA engineers can plan, acquire and install the needed tools for test automation and continuous integration.
- They can prepare the architectural plan with respect to the defined tool.
Requirement gathering for non-functional testing:
- QA engineers can utilize this Sprint Zero time to get information or details about other non-functional requirements like performance testing, security testing, accessibility testing.
Requirement planning for non-functional testing:
- They can investigate, inquire and install the needed tools or extensions for the respective non-functional requirements.
- QA engineers can prepare the architectural plan with respect to features or coverage on browsers and devices for the respective tool.
Benefits
- Approved acceptance criteria will help to cross-check and freeze the requirements with the PO which can be considered as a source of truth across the team.
- Defects can get detected even before they get coded and tested.
- Clarity of work - Sprint Zero offers a chance to plan a framework for success or create a working environment.
- Creating RTM will help you to do an impact analysis when any particular requirement changes.
- Fewer risks involved in the projects
- It builds confidence in team members that they can handle the work to come.
- Utilization of QA time for better QA process in a team.
- Improves product quality and offers a healthy start to the project.
Conclusion
Of course, these activities can vary from project to project as per the types of the requirement you will get. Basically, Sprint Zero helps to set the direction of what testing needs to achieve and how testing needs to be carried out throughout the sprints. It’s worth saying that QA's role is very crucial in building a quality product and thus lets start participating in Sprint Zero and contribute towards the project's success.
Happy Testing!

How to test your Browser Cookies?
We often come across pop-ups while browsing websites. We usually accept the cookies without knowing anything about them, to browse the website without any hiccups. So, let’s understand what browser cookies are and how to test them.

What is a cookie?
A cookie or browser cookie is a small piece of data from a specific website that is stored on the user’s browser while they access that website. In other words, a cookie is nothing but the user's identity for their browser. This information gets saved in the form of a text file by the web server and can be used to interact with the server through the browser. It makes it easier for the browser to remember the user and the navigation they do, on their next visit.
What are the uses of a browser cookie?
Browser cookies have different functions such as:
- Maintaining a user’s shopping cart or preferences on the e-commerce websites
- Keeping track of user’s browsing data on websites, where cookies are used to display ads as per the user's interests that have been tracked previously and recorded within the cookie. This enables us to see personalised ads on sites like Facebook after browsing the products on shopping websites like Amazon
- Remembering your session for a specific website, such as Facebook, Google, YouTube, etc. Cookie plays an important role in session management. It enables a user to restart the website without having to log back in
Cookies were designed to identify the system, however, they are now also being used to keep a track of user’s online activity. This can be a threat to user’s privacy, depending on how the website decides to use this information.
Why should we test cookies?
Cookies contain user's information that can be used to communicate between different web pages and track a user’s website navigation. To avoid any security threats, it is important to keep a check on how cookies are written and saved in the system. Since some functionalities might behave differently when cookies are set, it’s crucial to test the cookies to verify how an application behaves and responds based on the status of the cookie.
How do cookies work?
Let’s understand how cookies work with an example: Suppose you visit an e-commerce website for the first time. The website will assign a cookie in your system as a unique identifier. This unique id is then used to keep track of your overall browsing session from start to finish. It keeps a check on all the products you browse or add to your cart and use the information to suggest similar products to you.
In this scenario, the cookie is specific to the website and can’t track you on a different website.
What are the properties of a browser cookie?
Go to the Application Tab and click on the Dev tool, there you can find the option to access the browser cookie.
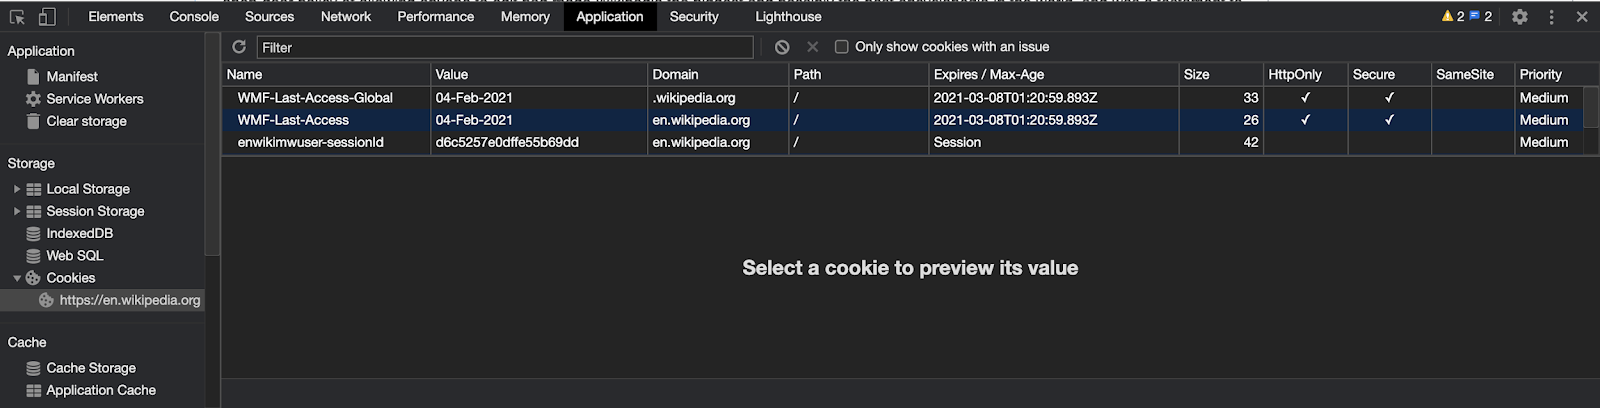
Name: This is the cookie’s name, which is set by the server
Domain: This attribute is used to indicate if the browser should accept cookies or not
Let's look at some scenarios of different domains:
- Matching Domain - Suppose the cookie is set by the domain itself after visiting https://en.wikipedia.org/wiki/Wikipedia, as shared in the screenshot above, then the browser will accept the cookie because the Domain host includes the host where the cookie is originated from.
- Different Host or Subdomain - Suppose the cookie is set by “mx.wikipedia.org/wrong-domain-cookie”, but the ‘Domain’ attribute is “en.wikipedia.org”. Even though they are on the same domain, their subdomain is different. In this case, the browser rejects this cookie.
- Wrong Host - Suppose the cookie is set by “xyz.com/wrong-domain-cookie”, but the ‘Domain’ attribute has “en.wikipedia.org”, then the browser will reject such cookie.
- If the cookie is set as domain=”.wikipedia.org”, this means that the cookie can be used on all the subdomains of wikipedia.org.
Expires/Max-Age: This attribute indicates the expiration date of the cookie. This is mostly a session cookie, which means the cookies will expire when the user closes the browser window.
HTTPOnly: If a value of this attribute is true, it means that the cookie can only be used by the website built over HTTP and not by the javascript code.
Secure: If the value of this attribute is true, it means the cookie can only be used over a secure connection, i.e. HTTPS.
SameSite: This attribute is used to improve cookie security by preventing cross-site request attacks and privacy leaks.
The values of SameSite are the following:
- Strict - Cookies will fire when the domain in the URL matches the cookie’s domain, which is a first-party domain and the external link is not coming from the third-party or any external sites.
Now, let's take a scenario where the cookie is set as SameSite=Strict. The site you are browsing has a button called “Login” which displays an image to the user. The user can access the image only when the set cookie is sent from the same site and not from any third-party website.
Strict prevents the cookies to be sent over on a cross-site request.
- Lax - This is the default value. Cookies will fire when the domain in the URL matches with the cookie’s domain which is a first-party domain.
- None - This allows third-party or external sites to send the cookies over a secure HTTPS connection. There are no domain limitations, so it allows all the requests as in the case of the Secure attribute.
Let's look at some more attribute values and the respective scenarios:
Domain = ‘.example-a.com’ SameSite = Lax;
Suppose a user is browsing an example-a.com website that contains a link from another example-b.com website. If the user accesses that link to go to example-b.com, then it's called a cross-site request. The Lax cookies will be sent to example-b.com, but not the Strict cookies, as this is a cross-site request.
What are the top scenarios for testing browser cookies?
- Check that no personal or sensitive data like debit/credit card should be stored in the cookie, if it does then check that it is in the encrypted format.
- Disable the cookies from your browser's settings and try to use the website's major functionality.
1. If the website uses cookies for its major functionality, then it will ask you to enable the cookies to function properly.
2. That page must not crash if you disable the cookies.
- Reject the cookie and try to access the page. The browser should give all the information and the page should work as expected.
- Check that cookie written for one domain or website should not be accessible by another domain or website.
- Check that the web application is writing cookies on different browsers properly and the site will work properly against these cookies on multiple browsers.
- Validate expiration of the cookie is working as per the duration set for the application. If the requirement says that the cookie must expire on a particular date, then Value must be set as per the date. We must check that the date is set as mentioned and the cookie expires timely.
- Validate cookies for Guest and Authenticated Users - A website may behave differently for the same cookie when browsed by authenticated or anonymous users.
- Check if the cookie is persistent for a user, in case a persistent cookie exists.
- Validate that the attributes with sensitive information such as token id and user id are set as HTTP flag secured.
What are the extensions/plugins for cookie testing?
There are multiple extensions or plugins that can be used to test or edit the cookies. The most common one is EditThisCookie. This is a cookie editor and a Google Chrome extension.
Suppose you are browsing the site https://en.wikipedia.org/wiki/Main_Page. The EditThisCookie chrome extension will enable you to test or edit the cookies.
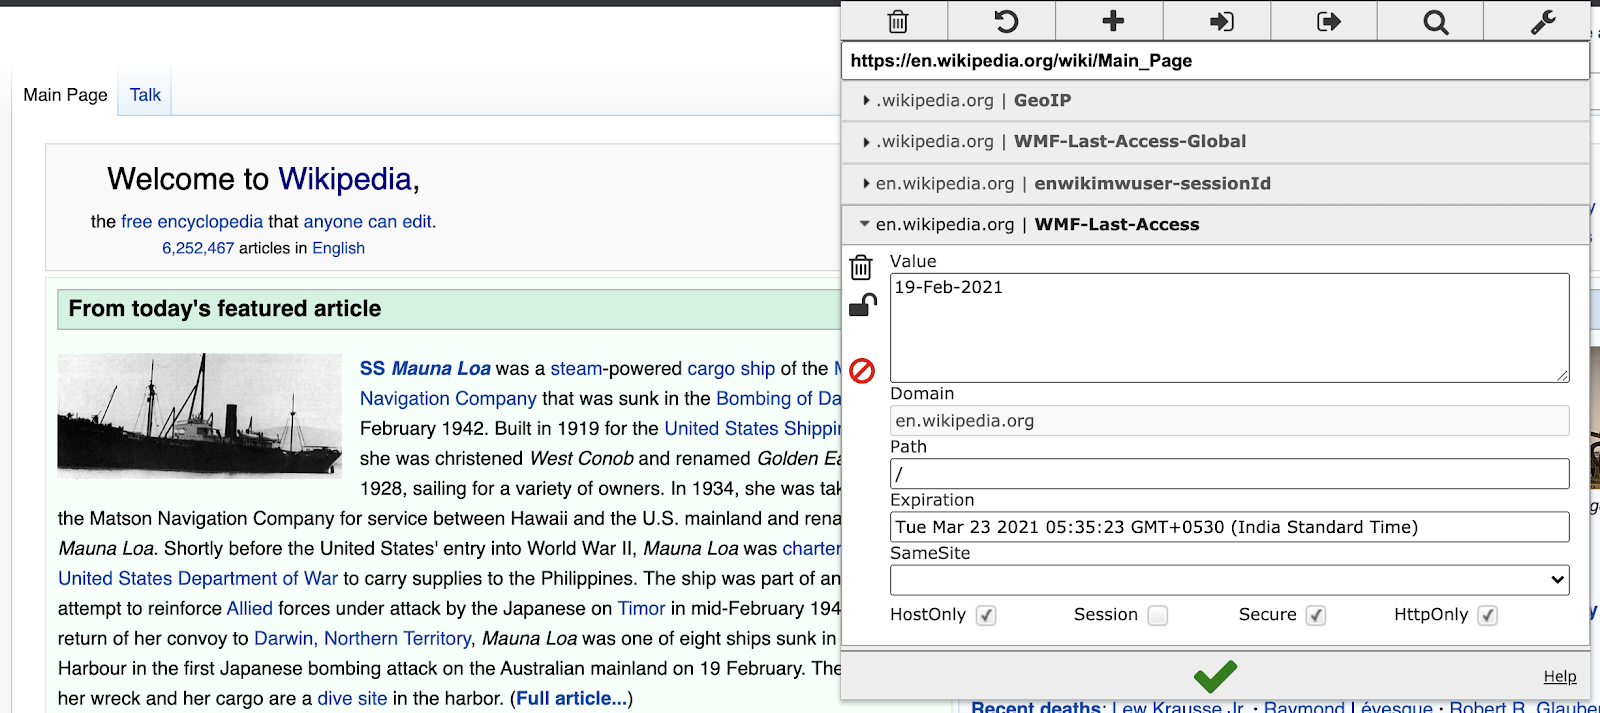
The pop-up screen for this extension displays the options to edit or test the cookies as per the requirement.
How to expand a cookie?
- If you want to check how your site will respond if you block any of the cookies, then click on the Block icon to block that particular cookie. This will help protect your privacy.
- If you want to check the site functionality once the cookie is deleted, then click on the delete icon. Check the page behaviour once the cookie is deleted. After removing or deleting the cookies, the page should behave as expected without giving any errors.
- If you want to check the behaviour of the site after editing the cookie, then edit any fields as shown in the above screenshot. Refresh the page and check the behaviour of the page. From the security perspective, we should check the behaviour of the website page by corrupting or editing the cookie information. Edit the value of the cookie manually, like name or expiry date, and check the site's functionality.
- You can protect the cookie by clicking on the icon. Once you click on the icon, that cookie will be set as protected. This means the browser will not be able to change its value and it's protected now.
- You can create a cookie by clicking on the + icon from the top options. You can create your cookie -> access the other subdomain -> check if that is accessible or not.
- You can also import or export the cookies through this extension. Importing will enable you to share the cookies among different systems and test the website. Exporting will allow you to copy the cookie and paste it outside of the website.
Can cookies be managed with automation testing?
Yes, every tool in automation testing allows managing the browser cookies. It helps in automating the website functionality that is dependent on the cookie. Sharing some guideline documents of what these tools are and how the cookies can be managed in the automation test suite.
Selenium - https://www.selenium.dev/documentation/en/support_packages/working_with_cookies/
Cypress - https://docs.cypress.io/api/cypress-api/cookies.html#Syntax
NightWatch - https://nightwatchjs.org/api/commands/#cookies-headline
WebdriverIO - https://webdriver.io/docs/api/browser/getCookies/
Happy Cookie Testing!

Site Studio Testing - The Ultimate Guide
Acquia Site Studio (previously known as Cohesion) is a low-code Drupal-based platform that allows content editors and marketers to create unique websites using components and layouts. It uses a drag-and-drop editing feature which provides fast and seamless learning for QA Engineers having less coding knowledge. We recently delivered a low-code, enterprise scalable, self-service platform and CMS for a German multinational pharmaceutical and life sciences company to build 1000+ websites and migrate 170 consumer brands. Based on our experience, we will be describing our QA process and the best practices for Site Studio testing.
Understanding Site Studio
We applied the W2H1 (Why-What-How) approach for understanding Acquia Site Studio from a Quality Assurance perspective.

Why is it important for your QA Engineer to understand Acquia Site Studio?
- When it comes to Acquia Site Studio (Cohesion) projects or any new platform implementations; the QA team must be well versed with the platform to deliver good quality results
- To identify the root cause of an issue - whether it is an issue with the component or backend functionality
- To validate whether the component is built and working as expected i.e. if it meets the business and user requirements
- To validate if the integration between the components (frontend) and the functionalities (backend code) is in sync with the interface requirement
- To validate the usability and compatibility of the website built
Top 6 things your Quality Assurance team should know about Acquia Site Studio
- Site Studio elements and templates
Site Studio (cohesion) provides a wide range of in-built form elements that can be used to create custom components as per project requirement. Site Studio also provides options to create various templates for the website - Master, Content, View and Menu Templates.
For example, a QA Engineer has created the header menu links at the backend but it is not rendering as expected at the frontend. In such cases, the QA Engineer should know which template to refer to, to identify the cause of the issue.
- How to create a custom component
Site Studio provides the ability to create components with very less code knowledge. This enables QA Engineers without much coding knowledge to create components and perform testing efficiently and effectively.
Let me share an example of our project, we were required to validate if the content of the “Modal” custom block reflects properly on to the frontend. This “Modal” component was yet to be developed by a 3rd party vendor.
So we created a component using the Site Studio “Modal” element and used it to validate the “Modal” block feature on the frontend!
- Purpose of the components and how they work individually
This knowledge helps the QA Engineer to validate if the component built meets the requirement and serves the purpose of reusability. In addition to this, it helps the QA Engineers to provide a workaround for any enhancement/condition-specific use cases, using the existing components.
- How components are integrated with the backend system to achieve the requirements
In our project, there was a requirement to launch a modal pop-up on clicking a menu link. In this case, a QA Engineer should understand how to sync the Drupal menu link and the Site Studio Modal component. And should also validate that clicking a menu link triggers the launch of the correct modal pop-up.
- For multi-site solutions with multiple themes, QA Engineers should know ‘Style Guide Manager'
Style Guide Manager helps to change styles and appearance depending upon the theme/subtheme. This would help the QA Engineers to validate if the changes made to style values in SGM are reflected correctly on the frontend for the corresponding theme.
- How to import/export Site Studio package on a site
Acquia Site Studio facilitates sharing of components, templates, styles and configurations with other websites using the import/export package option.
QA Engineers can import and export packages using either UI or Drush. For Site Studio projects, QA Engineers usually need to validate that the latest package (provided after each release) is imported and rebuilt successfully on the website. And the updated package is not breaking existing features.
This also reduces the dependency of the QA Engineers on the dev team for importing packages on various websites.
How to perform Quality Assurance testing for Site Studio?
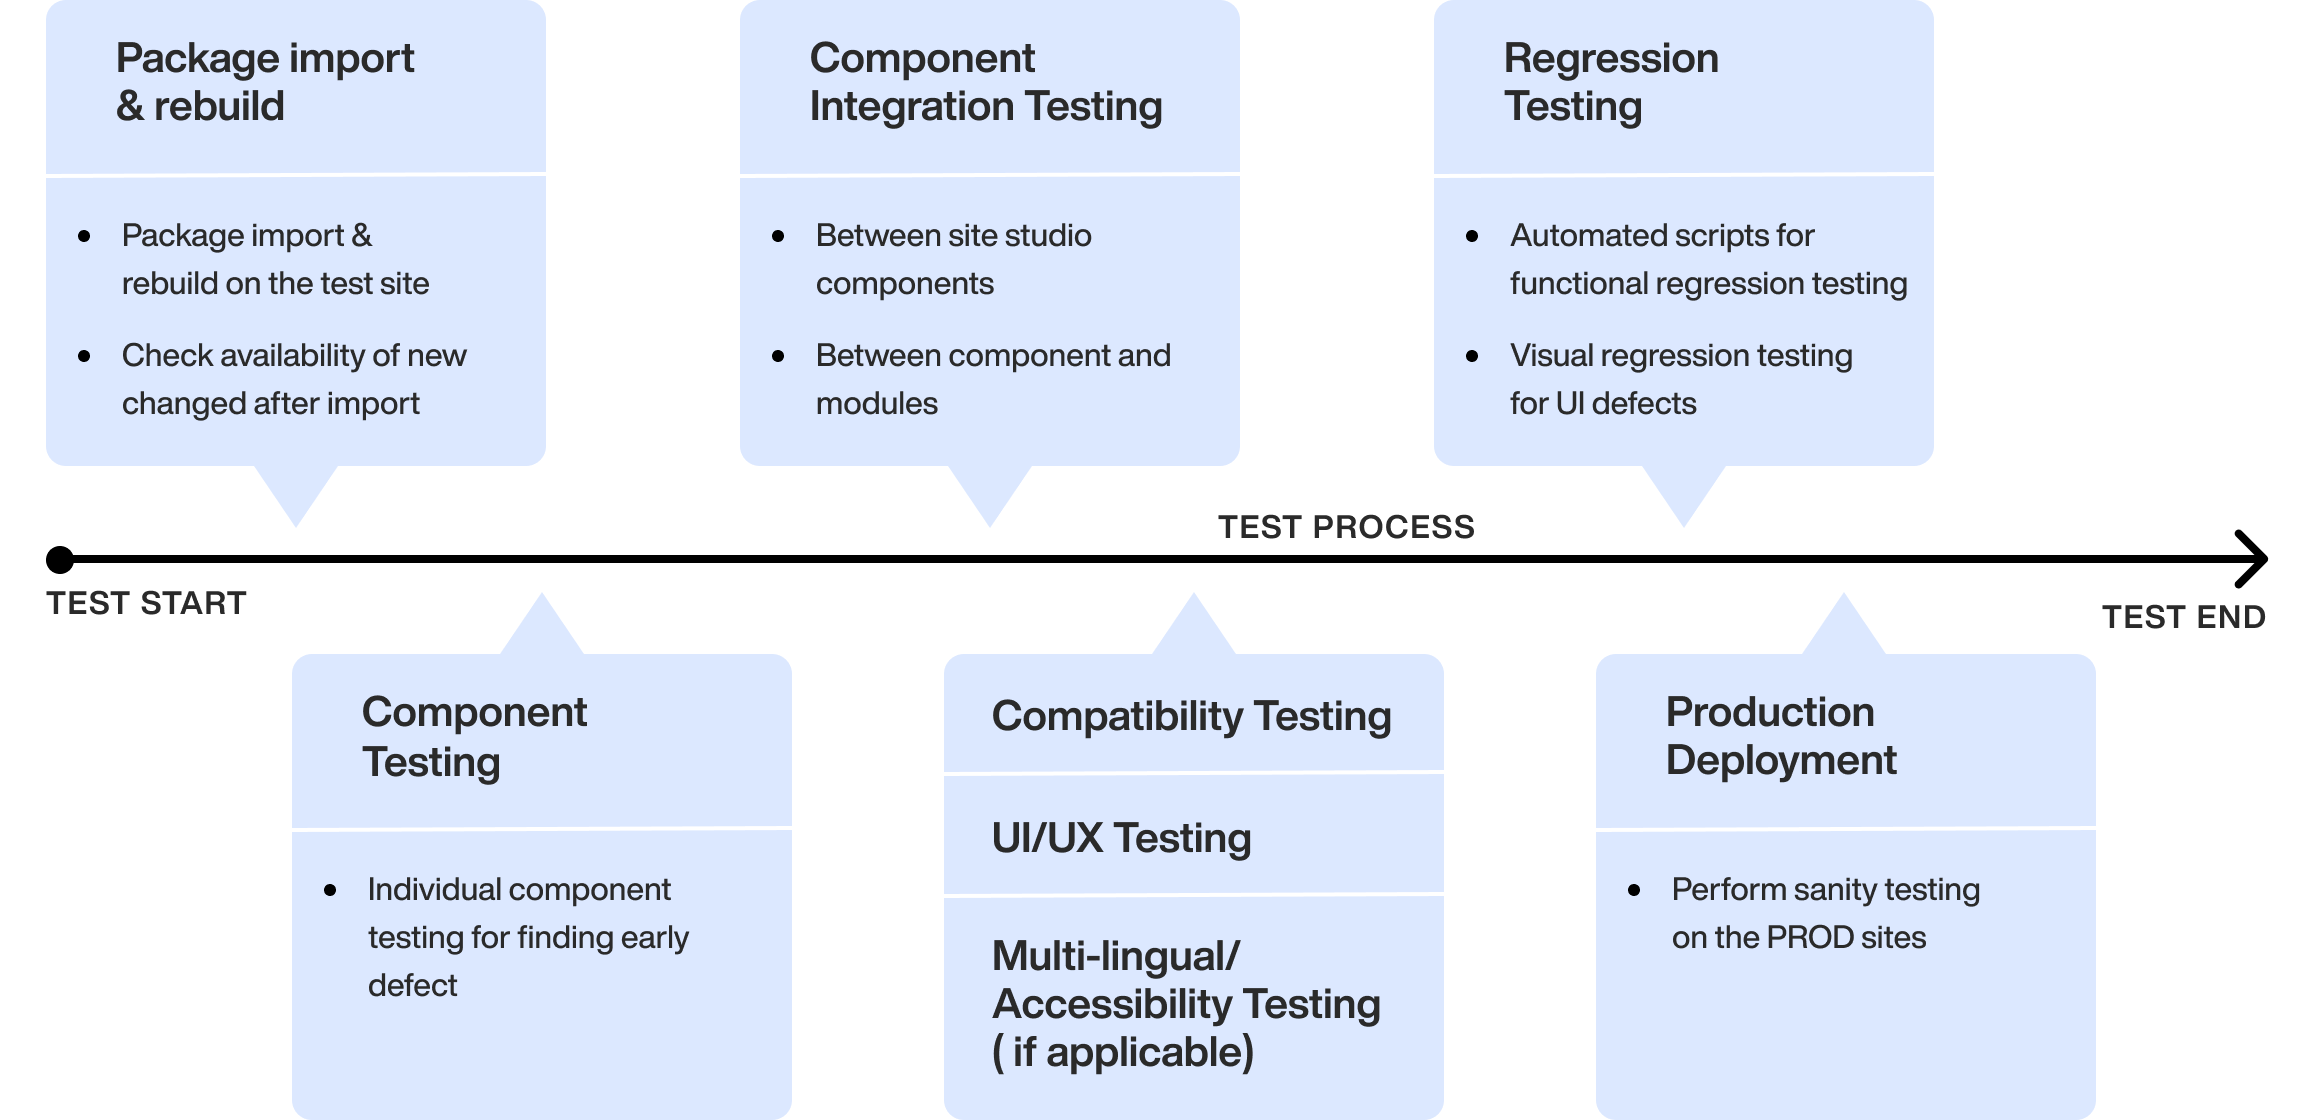
Focus areas for Site Studio Testing
Compatibility Testing
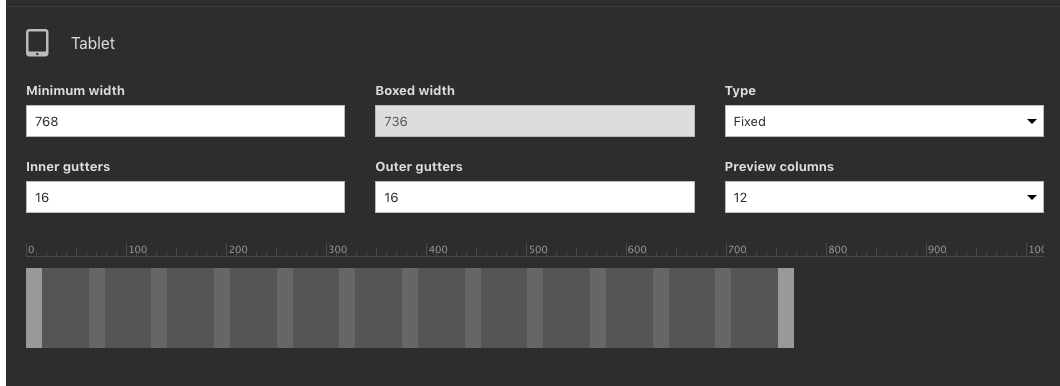
- Site Studio provides responsive support for different devices. QA Engineer needs to verify whether a particular component renders and works as expected across different devices - desktop, laptop, phone, and tablet.
- For example; a QA Engineer must check if there are any horizontal scrolling, alignment or font issues w.r.t the buttons on different devices and multiple screen sizes.
- QA Engineers need to verify compatibility across different browsers. Sometimes, a component may work correctly on Firefox, however, it may fail on Safari. So, we need to validate if the components are rendered as expected across browsers.
Regression Testing
Regression testing is to check if the modification/upgrade of the application has not led to a functional break. This testing involves the below activities:
- Ensure that the existing functionality still works after the Site Studio version is upgraded
- Selected test cases are re-executed to ensure changes have not impacted previously tested features
- Check if the end to end testing workflow works fine
- The data flow between components is working fine
- Check if the styles and user interface is not impacted
Integration Testing
Integration Testing is carried out once the individual components have been unit tested and are working as expected; without waiting for the entire system to be ready. This ensures early detection of defects and also helps in isolating the defects to particular component interaction.
For example, we had to ensure that the “Product Teaser View” and “Slider component” are ready at Drupal and Site Studio end respectively. QA had to validate if fields of the product teaser view are rendered correctly in the slider component. And an end-user can slide through products and navigate to the product's PDP page via click event.
UI Testing
The user interface is crucial when it comes to creating a reliable website. To ensure all the elements of the front-end work as expected and are displayed equally well for users across all devices and browsers.
There are a couple of factors to validate as part of UI testing:
- Styles/Icons/Font
- Templates
- Field widths
- Navigational elements
- Progress bars
- Menu items
- Table/Slider scrolling
- Error logging
- Action buttons
- Modal Pop-up
Multilingual + RTL
When content is translated into languages other than English, it gets expanded in length, this might affect the UI/UX of the website. English texts are usually short compared to other languages. Therefore, translated content leads to truncation, overlay on or under other components and so on.
Testing of components using Right-to-Left language requires special considerations such as the focus on text alignment, ordering of components within the layout, positioning of buttons, dropdown, data entry fields, so on. Therefore, QA Engineers need to make sure that no components and design are breaking for multilingual and RTL language sites.
Automated Regression Testing
To achieve enhanced product quality and team agility, it is always ideal to automate regression testing. The regression test suite should include both functional and UI test cases.
- Functional Regression:
Functional regression testing is essential for verifying that components of our system are working as expected after a code change. For Site Studio, we automated functional regression test cases such as the creation of contents using components, interaction with components and so on, using an automation tool called Behat.
After every release, we ran the automated functional regression test suite. This ensured that existing core features were working as expected and also increased the chance of detecting bugs caused due to the change.
- Automated Visual Regression Testing:
Apart from having fully functional components in the system, it is also important to be concerned about the user interface. Styling or CSS change can have undesirable effects on other components and might break responsive pages at different resolutions. Therefore, we need visual regression testing.
Visual regression testing is a visual comparison between the base and test image versions. However, today there are a huge range of browsers, devices and screen resolutions and testing them manually has become impossible. Therefore, we need to automate this testing using a visual regression framework/tool such as Backstop JS.
Challenges we encountered while testing Site Studio
- Multi-site testing
Brand sites have specific design requirements apart from the Master Design System. When a new package is rolled out on multiple brand sites, we need to test that components and styles are rendering as expected on each brand site. This increases the testing effort and time. To minimize the testing efforts and find UI bugs, we can use visual regression testing tools.
- Managing package import/rebuild
QA Engineers need to verify that the package import and rebuild are successful. Sometimes, a package is imported successfully on the website but the rebuild fails. QA Engineers also need to ensure nothing breaks after import and rebuild, from both style and feature perspectives.
- Site Studio upgrades
Site Studio upgrades sometimes have an impact on the websites. Therefore, we need to perform regression testing on websites using upgraded versions on lower testing environments, to identify if there any impact or risk. Once the entire checklist is tested and passed, upgrading is performed on higher environments.
For example, with Site Studio 6.1.1 upgrade, there was a change: “Themes with Acquia Cohesion enabled and not set as default will no longer generate assets automatically”.
In our project, this impacted the websites using the sub-theme and as a result, components were not rendered correctly for that theme. The solution was to check the Build Site Studio assets checkbox in the appearance settings of the theme under the Site Studio section. Once this solution was applied successfully to existing sites using a non-default theme and to new sites, an upgrade was performed on higher environments.
- API outage
API Outage of Site Studio has a huge impact especially when we are developing, testing and deploying features. This blocks the activities related to site studio testing. Initially, when we started to use Site Studio in our project, we often faced API Outage. Now, Site Studio is very stable and consistent in terms of API Outage.
Conclusion
We covered the purpose and process of understanding Acquia Site Studio from a Quality Assurance perspective, along with the test approach that should be applied to any Site Studio and Drupal integrated project. We also focused on the areas of impact and the challenges that we encountered in our project. If you’ve worked on a QA project for Site Studio, we would love to hear from you!
Happy Testing!

Automated Data Migration testing for Drupal
Migration testing is to ensure that your application gets migrated from one system to another without affecting the legacy data and the functionalities. While the migration is in process, the testing team needs to ensure the integrity of the system is intact and that there is no data loss while migrating the data.
Data loss is the most common issue we come across in Migration Testing, and when we have huge data to be migrated we cannot completely depend on manual testing. Because it becomes impossible to verify content and compare it with the source data. If we have automation in place to check the vast amount of data, it will help us find data loss in less time and will give us more confidence in the migrated system.
Drupal 7 to Drupal 8 Migration
Let me share an example, we had a requirement to migrate a university site from Drupal 7 to Drupal 8. Since it was a university site it had heavy data/content including various courses, programs, staff, faculty, events etc. and we needed to ensure that all the data gets migrated with no data loss.
We had around 24 content types and each content type having thousands of nodes. It was impossible to verify this number of nodes manually. So we created an automation framework that helped us verify all nodes.
Our Tool Selection
We started exploring various options using existing functional tools like Behat, Selenium, Cypress, etc. but we wanted to avoid the browser interaction in this data verification process because visiting node pages and verifying data would require a lot of time and when it comes to 1000+ nodes it could take hours. Choosing functional tools which use browsers never suffice our needs when it comes to large amounts of data.
We Chose Drupal
Our source (D7) and destination (D8) were in MySql DB format, so we decided to create a custom tool to verify the data migration. We created a Drupal module having a custom Drush, command that would verify the migrated data. Helping us execute test fasters and at the same time utilise the existing drupal functionalities and its framework in our tool.
Our Approach
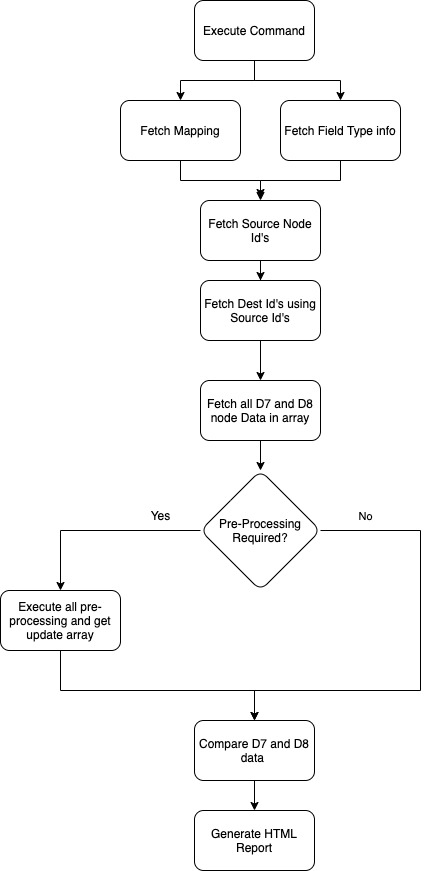
Creating Drush Command and Managing DB connections
We created the custom Drush 9 command - “drush migration:test <content_type_machine_name>”
The Drush command accepts two parameters - a content type name and the number of nodes to check, by default it would check all nodes.
Apart from this, we maintained two DB connections in the Settings.php file by adding another array for D7 - DB connection.
- Mapping Files
We required a few inputs before running the migration tests - we needed the information of each content type and its field mapping in D8. This helped us compare the data with the exact node and data inside each field.
We then created Mapping files in YAML format, each of these files was named in <content_type_machine_name>.yml format, each file had the following format:
The Fields array holds all the information about the fields from D7 to its corresponding D8 field and the Drush command uses these YAMLs as a source of input before querying the DB’s.
- Field Types Configurations
Each field type has specific columns in DB, and those particular columns were used to verify the data.
For example, each field having type text (we get this field type from a mapping file) will have a field table with column name as - <field_machine_name_value> as a column that will hold the actual data. We created field_type.yml which holds all the column information of each field type that will be used to fetch specific data for comparison.
Here the {fieldname} will get replaced with the actual field name from the mapping file. We had to maintain field type for D7 and D8 both because in D8 few column names were updated.
- Fetching all D7 and D8 Node values
To get the node data from the DB, we created a custom function that will dynamically create SQL queries based on mapping and config files for both D7 and D8 databases and fetch the values.
Since we have different naming conventions for tables in D7 and D8 we require to maintain the version name and change the prefix of the field table based on a version like D8 store field values in node_<field_name> and D7 stores in field_data_<field_name> same goes for storing node values D8 uses node_field_data table where D7 uses node table.
We used the fields option for mapping files and for each field, we use the field config file mentioned above to fetch the column of respective fields. Once all the tables and columns are collected we Command-Line built and executed the query on the respective database.
- Comparing Data and Generating HTML Report
Once the data for both D7 and D8 is fetched, both the sets of arrays were compared and failed nodes were logged in the reporter which then generated the HTML report after comparing all the nodes.
Reports
Reporting was important so all stakeholders could understand the reports and identify the issues mentioned in the reports. We created reports in 2 formats:
- Command Line - This was easy to understand and see the progress of test execution. It gives an overview of the number of tests that failed and passed and also provides a link to the HTML. report
- HTML Report - The HTML report had a detailed analysis of the test run, with all the information of failures and passed test cases.
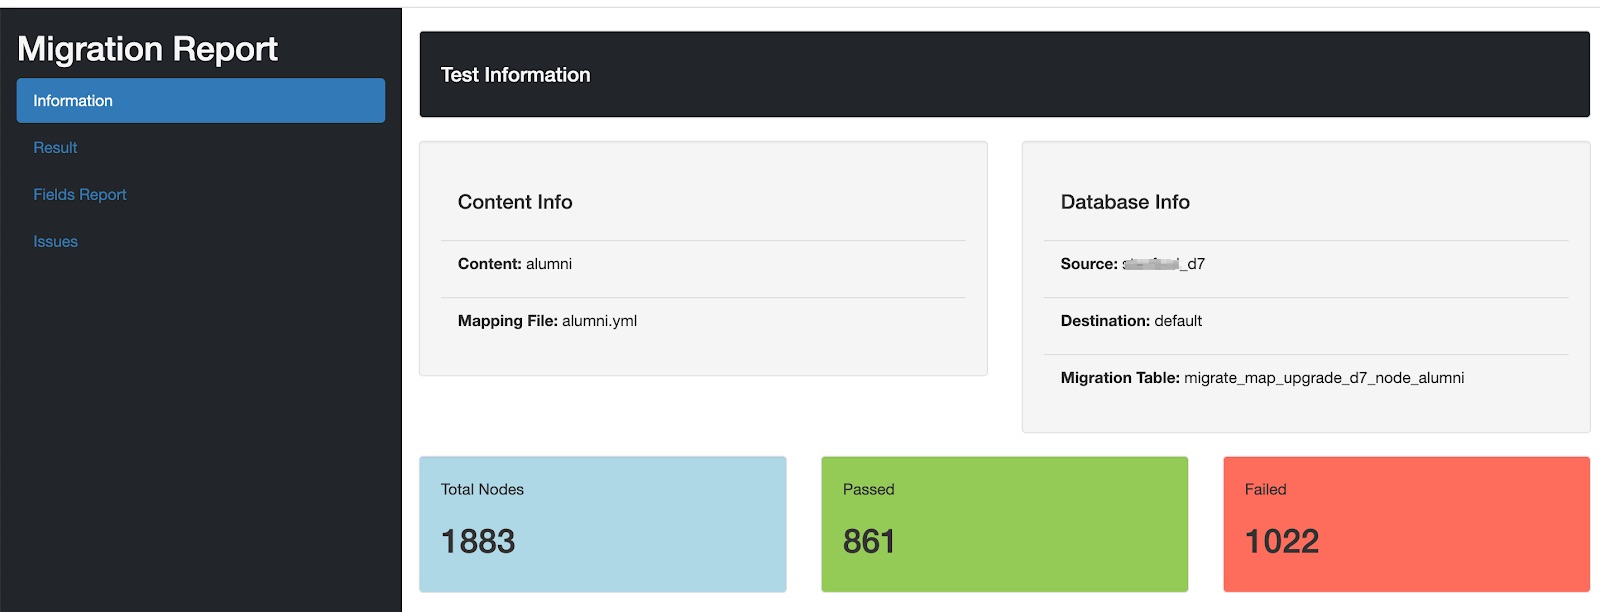
- The Test Information section provided the basic information of the test and content under the test like content name, migration table, mapping file, etc.
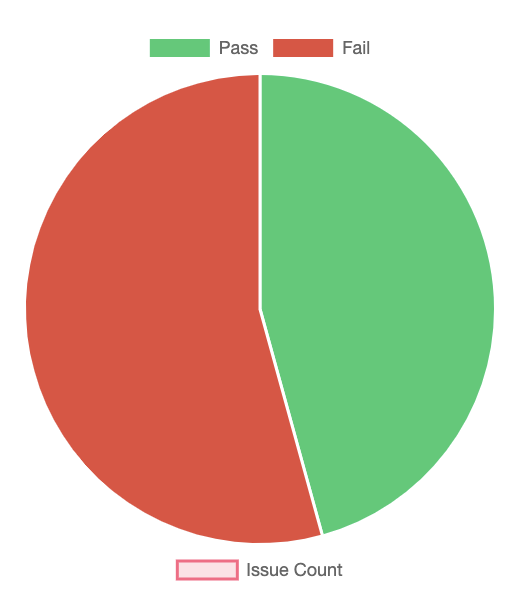
- The Result Section provided a pie chart with the exact number of pass and failures.
- The Fields Report Section highlights the fields’ columns that failed for a particular number of nodes.
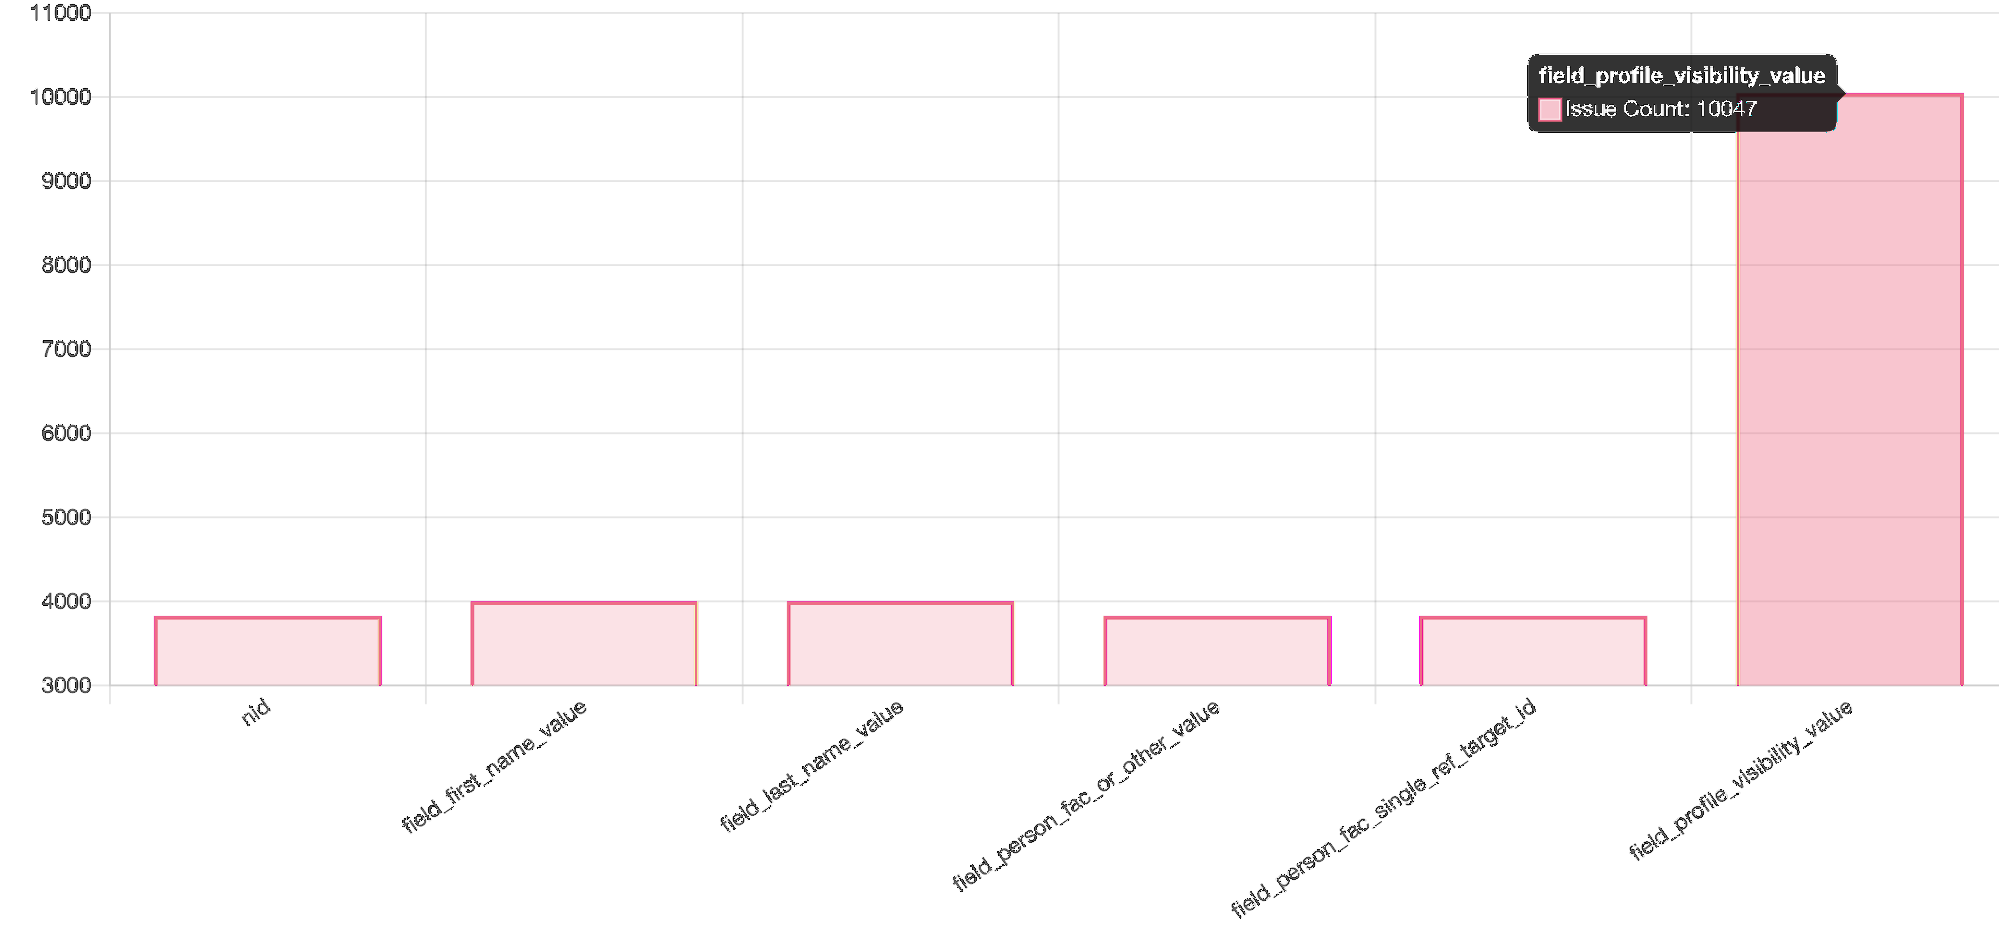
As shown in the above image, the profile visibility field has seen issues with around 10000+ nodes.
- Issues section - This shows the values that are missing or are not matching with the D8 migrated data.
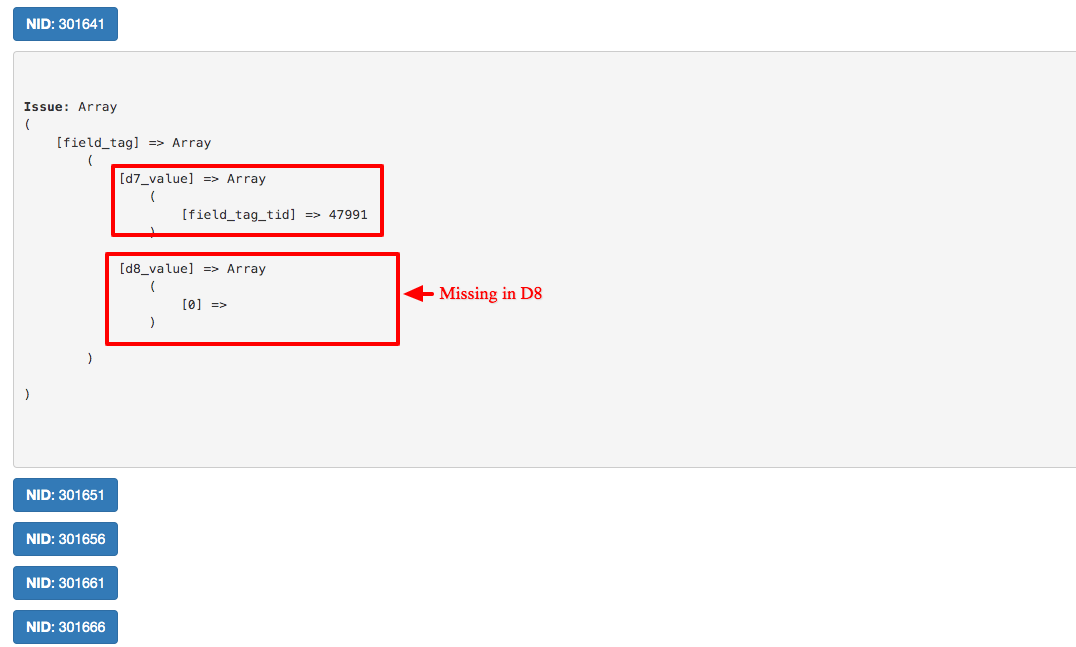
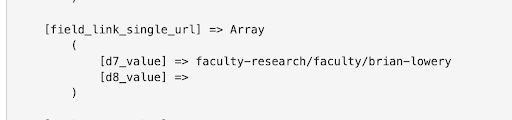
Referring to the above images - we can go through each node and verify the issue and compare the D7 and D8 values that are seen after migration. For example in the above image for field_tags, the tid is missing in D8 which means this tag was missing in the node after migrating it to D8.
Challenges
- False Positives
Because of the client requirements and changes in data format, there were various false positives. There were fields from D7 which were stored in different formats in D8. Following are a few examples:
- Boolean values 0 and 1 changed to true and false
- Date UTC timestamp got changed to other Date formats
- URL was prefixed in D8 as “internal:/”
- The Name field was getting divided into 2 fields First Name and Last Name
- Multiple fields were merged into 1 field
To handle such false positive scenarios we added one more step of preprocessing before comparing the D7 and D8 data. Prepossessing functions were called based on the field type, field name or content type.
The prepossessing class had all preprocessing functions based on the specific field type, field name or content type. These preprocessors updated the D8 data as per changes required and returned the values of the updated array.
Here’s an example of Link Preprocessing for one field:
- Field Collections to Paragraph Migration
D7 had a list of field collections that were used in nodes, these field collections were going to get merged as paragraphs in D8 and had around 44 types of field collections, which were directly mapped to paragraph fields. To handle this separately we directly verified field collections data with paragraphs using different Drush commands because the structure and way of storing data in field collections and paragraphs were different from normal fields.
So we created 2 YAML fields which stored a list of field collections fields and another for paragraph fields.
An example of FieldCollection.yml:
Example for ParagraphType.yml
As shown above, each field collection type had a paragraph type mapped and every field in field collection was mapped to fields in paragraph type. The rest of the process was the same as for nodes; only table and column prefix would be changed.
Demo
Outcomes
- We were able to find and fix more than 5000+ migration issues, which was difficult to find as part of manual testing.
- The creation of the test case was easy and quick, the user had to only create a mapping YAML file.
- Test execution was fast, we were able to test around 5000+ nodes in less than 10secs.
- Reduced the testing efforts and time is taken for testing.
- Good and readable reports helped all stakeholders to understand the issues.
- Dev-testing was easy and quick for developers, they were able to execute tests and identify bugs before passing them to the testing team.
- This framework can be reused and implemented for various content like taxonomy migrations, user migrations etc.
- Improved confidence of stakeholders in delivering huge data migration without data loss.

Automate SEO factors testing using Behat - Part 2
In our previous blog post Automate SEO factors testing using Behat - Part 1, we covered SEO factors - meta tags, keyword and image optimization. Here we are going to cover the remaining SEO factors.
Redirection
Redirects are the technique to forward users and search engines from an old URL to the correct URL.
Types of Redirection:
- 301 Moved Permanently is a permanent redirect which is best to be implemented for SEO ranking.
- 302 Found/Moved Temporarily is a temporary redirect used indicates that requested resource has been temporarily moved to new URL
- 307 Moved Temporarily is also a temporary redirect similar to 302, the only difference is that the HTTP method remains the same in the request.
Sample Scenario:
Given I am on “/redirect.php”
Then the response status code should be 301
And I should be redirected to “/redirect/redirect.php”
RedirectContext method:
Robots.txt
The robots.txt is a text file that instructs the search engines crawlers which page of the site is accessible. In a robots.txt file, we can specify allow or disallow rules for all user-agents or specific user-agent(s). When the file contains a rule that applies to only one user-agent, a robot will follow the URLs/sitemap specified for it. To ensure robots.txt file is found, always include it in the root domain. In case of robots.txt file is added in the subdirectory, it would not be discovered by robots and the complete page would be crawled.
Basic format:
User-agent: [user-agent name]
Disallow: [URL string not to be crawled]
Allow: [URL string to be crawled]
(Note: Only applicable for Googlebot)
Crawl-delay: [Time in seconds for the crawler to pause crawling the page]
Sitemap: [XML Sitemaps associated with the URL]
Sample Scenario:
Given I am a "Googlebot" crawler
Then I should be able to crawl "/crawl-allowed"
RobotsContext method:
Sitemap.xml
The sitemap is an XML file that provides search engines with the list of URLs, available for crawling on a particular website. A sitemap is mostly useful when a website is new with few links or content is large or it has rich media content. In such scenarios, a sitemap provides Google with pages that are more valuable and informative on the website.
For large websites, we may end with many sitemaps. Here, we can split large sitemaps using the sitemap index. Following is the XML tags for sitemap index file :
- sitemapindex - The parent tag of the file.
- sitemap - The parent tag for each sitemap listed in the file
- loc - The location of each sitemap
Sample Scenario:
Given the sitemap "/sitemap/valid-sitemap.xml"
Then the sitemap should be valid
SitemapContext method:
Extension module “marcortola/behat-seo-contexts” also provides the following validations:
- Then the sitemap URLs should be alive
- Then the multilanguage sitemap should pass Google validation
- Then /^the sitemap should have ([0-9]+) children$/
Schema.org Markup
Schema.org is a collaborative effort between Google, Bing, Yandex, and Yahoo to create structured data markup. This will provide information to search engines about the page and enhance rich results experience.
Sample Scenario:
Given I am on homepage
Then the page HTML markup should be valid
HTMLContext method:
HTTP Status code
HTTP status code is a three-digit response sent by a server for a browser's request.
Common status code classes:
- 1xxs – Informational responses
- 2xxs – Success!
- 3xxs –Redirection
- 4xxs – Client errors. It is a good practice to return a 404 error page when the correct URL is not found.
- 5xxs – Server errors
We can use the existing step - “Then the response status code should be 301”, to validate HTTP response code.
Hreflang Tag
Hreflang tag is an attribute which helps search engines to show the correct version of the page based on a user's location and language preferences
Format: <link rel="alternate" href="http://example.com" hreflang="en-us" />
- rel = “alternate” - Indicates that content exists in alternate language(s)
- href - Specifies the URL of the content
- hreflang=“x” or “x-default” - Hreflang shows the relationship between web pages in the alternate languages.
- Format of “x” is language code or language - country code. It is used when a page exists in a particular language. For ex. hreflang = “es” or hreflang = “es-mx”. (Note: Language code is always before country code)
- hreflang="x-default" is used when there is no language/region match for a page.
One of the rules is that hreflang tags are bidirectional/reciprocal. Bidirectional means - When an English page is linked to Spanish page, then Spanish page must link back to the English page.
HTML Markup:
<link rel="alternate" href="https://www.qed42.com" hreflang="en" />
Sample Scenario:
Given I am on “/valid-hreflang.html”
Then the page hreflang markup should be valid
LocalizationContext method:
Page Speed
Page Speed (page load time) is the measure of time taken to fully load content on a page.
Some of the ways to increase page speed :
- Minify CSS, JavaScript, and HTML files of the website
- Enable Leverage browser caching for images, CSS and JS
- Minimize Redirects
- Optimize images
Extension module provides performance context that covers - Testing HTML minification, Testing CSS minification, Testing JS minification, Testing browser cache and Testing JS loading async or defer. Below is the snippet for CSS/JS minification.
Sample Scenario:
Given I am on "/performance/html/minified.html"
Then HTML code should be minified
PerformanceContext method:
URL Optimization
A URL (Uniform Resource Locator) is a human-readable text that specifies the location of the webpage on the internet. A URL has the following basic format: protocol://domain-name.top-level-domain/path
- Protocol - The protocol determines how to communicate data between the server and a web browser when sending/retrieving resources. HTTP and HTTPS (secure) are two of the most common protocols.
- Domain-name - It is a unique identifier or name of the website.
- Top-Level Domain (TLD) - It is an extension to the domain name. For example, .com, .net, .edu, .org, etc.
- Path - Path is the exact location of the page/file on the website. The path includes specific folders and/or subfolders where the resource is located.
SEO best practices for URL optimization:
- Make URL readable to human and search engines
- Match URL with the page title and heading
- Use relevant page keywords in the URL
- Remove dynamic parameters from the URL
Good URL - https://www.example.com/seo/meta-tags
Bad URL - https://www.example.com/seo?=id=54321
We have covered the major SEO factors that affect the ranking of the site in the SERP and how to automate them using Behat. Hope this blog was informational!
If you'd like to automate the SEO of your site, reach out to business@qed42.com.
Happy Automation!!!

Automate SEO factors testing using Behat - Part 1
SEO services are usually expensive and hard to find since they require a considerable time and technical expertise. A handful of SEO factors can be automated with the right tools. In this blog, we will explore how to automate SEO factors using Behat.
Let’s understand what Search Engine Optimization is
Search Engine Optimization is the process of implementing a series of techniques on a website to improve your site’s visibility for relevant keywords on search engines.
How to automate SEO factors using Behat?
In order to automate various SEO factors using Behat, we will be using the extension module “marcortola/behat-seo-contexts” with our additional custom contexts.
Let's understand the major SEO factors and how these can be automated.
Meta Tags
Meta tags are the HTML tags that provide important information about the web page to the search engines. This metadata appears only in the page’s source code.
- Title tags - A title tag is an HTML element that specifies the title of a web page. The title tag is important for SEO because it appears as a clickable link in the search engine results page (SERP) and in browser tabs.
HTML Markup - <title>Drupal Development and Design </title>
Sample Scenario -
Given I am on homepage
Then the page title should be "Drupal Development and Design"
MetaContext method -
- Meta Description - The meta description is an HTML attribute that provides a brief summary of a web page. Meta tag does not influence ranking, however, has an impact on the page's click-through rate (CTR).
HTML Markup - <meta name="description" content="A service open source company."/>
Sample Scenario -
Given I am on homepage
Then the page meta description should be “A service open source company.”
MetaContext method -
- Canonical Tags - A canonical tag is an HTML link tag which tells the search engine that a specific URL is the original copy of the page. Canonicalization is important because it controls your duplicate content.
HTML Markup - <link rel="canonical" href="http://example.com/" />
Sample Scenario -
Given I am on homepage
Then the page canonical should be “http://example.com/”
MetaContext method -
- Alternative Text Tag - Alt text is an HTML attribute that describes the image on a web page. Alt text renders on the page when the respective image fails to render. This text helps the search engines to better interpret the image and rank the website.
We have added below custom “AccessibilityContext” context to validate the alt text attribute, as this is not supported by the extended module.
HTML Markup - <img src="/themes/qed42/logo.svg" alt="Home" />
Sample Scenario -
Given I am on homepage
Then the images should have alt text
Accessibility Context method -
- Robot Meta Tag - Robot meta tag provides instructions to search engine bots on how to crawl and index content of the web page. The robot tag has four main values for the crawlers:
- follow - The bot will follow all the links in that webpage
1. index - The bot will index the whole webpage
2. nofollow - The bot will NOT follow the page and any links in that webpage
3. noindex - The bot will NOT index that webpage
Note: When the robot tag is missing, crawler considers the site to be indexed and followed.
The extended module provides support for validating only index/no index values of robots tag. Therefore, we have added below custom context to validate the nofollow/follow values.
HTML Markup - <meta name="robots" content="INDEX, NOFOLLOW" />
Sample Scenario -
Given I am on homepage
Then the page should be nofollow
MetaContext method -
- Open Graph Meta Tags - Open Graph tags control what content / URLs are displayed when shared on Facebook. The four required properties for every page are:
og:title - The title of the page/content/object as it should appear on Facebook, e.g., "QED42".
og:type - The type of the object, e.g. blog, articles. Depending on the type you specify, other properties may also be required.
og:image - An image URL which represents the object. Images must be either PNG, JPEG and GIF formats and at least 50px by 50px.
og:url - The canonical URL of the object that will be used as its permanent ID, e.g., "https://www.qed42.comwww.qed42.com".
The following properties are optional for any object and are generally recommended:
- og:audio - A URL to an audio file to accompany this object.
- og:description - A one to two sentence description of the object.
- og:determiner - The word that appears before this object's title in a sentence. An enum of (a, an, the, "", auto). If auto is chosen, the consumer of your data should choose between "a" or "an". Default is "" (blank).
- og:locale - The locale these tags are marked up in. Of the format language_TERRITORY. Default is en_US.
- og:locale:alternate - An array of other locales this page is available in.
- og:site_name - The name of the site which should be displayed for the overall site. e.g., "QED42".
- og:video - A URL to a video file that complements this object.
HTML Markup - <meta property="og:url" content="https://www.qed42.comwww.qed42.com" />
Sample Scenario -
Given I am on homepage
Then the Facebook Open Graph data should satisfy full requirements
SocialContext method -
- Twitter Cards tags -
Twitter:card - It describes the type of content. The card type can have one of these values - “summary”, “summary_large_image”, “app”, or “player”.
Twitter:title - Title of content
Twitter:description - The summary of the content.
Twitter:url - A canonical URL for the content
Twitter:image - A URL to a unique image representing the content of the page
HTML Markup - <meta name="twitter:url" content="https://www.qed42.com" />
Sample Scenario -
Given I am on homepage
Then the Facebook Open Graph data should satisfy full requirements
SocialContext method -
Note: Here, getOGMetaContent() method is the same as mentioned in the Open Graph Meta Tags section.
- Header Tags - Header tags provide hierarchy and context for a page. The heading elements go from H1 (most important) to H6 (least important). Text with an H1 tag indicates the search engine that it’s the most important text on that page. This factor does not have much impact on the ranking of the site on SERP.
- Responsive Design Meta Tag - Viewport meta tags are used for responsive websites. The viewport meta tag allows web designers to scale/size pages and display on any device.
- width=device-width: Sets the width of the page to follow the screen-width of the device.
- initial-scale=1: Sets the initial zoom level when the page is first loaded by the browser.
We have added below custom “UXContext” context to validate the viewport tag, as this is not supported by the extended module.
HTML Markup - <meta name="viewport" content="width=device-width, initial-scale=1">
Sample Scenario -
Given I am on "/ux/site-with-valid-viewport.html"
Then the site should be responsive
UXContext method -
Keyword Optimization
Keyword optimization is the process of identifying and selecting keywords to be incorporated into a website's content, which will drive traffic from the search engines to the website. By analyzing the words searched, we can understand what the user needs.
We can achieve keyword optimization, by using keywords in - title tag, meta description, URL, links, keywords in the image alt attribute. You can refer to the Meta Tag section on how we can optimise keywords using various meta tags.
Image Optimization
Image optimization involves two things:
- Reducing the size of the image without losing quality
- Giving appropriate name and identity to the image - ALT Tag
A high number of images on a web page impacts page load time. And Google uses page load time as a factor for ranking. Therefore, we need to ensure the quantity of image, size of image and quality of the image added on a web page.
We have covered the SEO factors - Meta tags, Keyword, content and image optimization. Check out our next blog (Automate SEO factors testing using Behat - Part 2) in this series to discover more SEO factors like Automation to validate image optimization is covered under Page Speed SEO factor.
If you'd like to automate the SEO of your site, reach out to business@qed42.com.

Improve performance and avoid false negatives by getting rid of hard-coded waits!
Automation suites are often used to reduce manual testing efforts or to obtain testing results in less time. However, inappropriate coding practices or scripting sometimes affects the script execution performance and ultimately increases the script execution time. Many factors contribute to the automation script execution performance. One of the most notorious ones is the " hard waits " in step definitions.
So what are Hard waits?
Hard waits are applied to automation scripts for elements being rendered on a page. It will try to find an element for a ‘defined’ time and if within this time if the element is not found, it will throw an error. If an element is found, then it will allow you to perform further actions on it.
Let’s discuss this in more detail.
Many times, I have come across these "hard waits" being applied in step definitions. Consider the example below:
- What if the user reaches the login page within 1 or 2 seconds? Test suites will be waiting for 10 seconds for nothing.
- What if you get a response in more than 10 seconds then the test suite fails, no matter if the cause of this is anything else let’s say slow network problem
Now if there are “n” number of scenarios then the “wait” seconds keep on getting multiplied with the number of scenarios and thus increasing the script execution time.
To resolve this issue, we can write a custom function to replace the step “And I wait for n seconds” as following:
In the above custom script, we are trying to find an element first using findElement() function with certain conditions applied in the loop. Here, the script will wait for an element to load and then perform an action on it. So we don’t need to add “And I wait for n seconds” and we don’t have to worry about how many seconds it will take for an element to load.
Now our step definition will finally look like this:
And here is how we call the “findElement” function for elements before we perform any action on the respective element.
The script will keep trying to find an element and there will be a limited number of tries. After this, if an element is not found, the test suite will fail.
Do try to avoid using “hard waits” in step definitions by using the above custom function and observe the time taken for script execution. These are a few tips on how to write precise and accurate step definitions that help improve script execution performance.
If you would like QED42's help in setting up or improving your automation suites please reach out to us!
Happy Testing!

Zephyr for JIRA: Features
In our previous post Zephyr for JIRA: Basics, we discussed how to integrate Zephyr with JIRA and how to use it for test management. In this blog, we will explore some of the handy features of Zephyr for JIRA that facilitate efficient test management.
Test Cycle Features
- Freezing Test Execution Column: Select up to 2 columns to ‘Freeze’ by clicking the pin icon in the header columns.
- Cloning Test Cycle: Cloning essentially copies an existing test cycle and all the tests that it contains. It zeroes out all execution status, comments, attachments, and defects filed.
- Test Cycle names are not unique and Folder names are unique.
- The folder also has a count of the total executions in it and how many are executed.
- The progress tracking status bar provides a quick view of how many tests have been executed.
- All folder execution progress and numbers are added to the parent Test Cycle

Agile Test Boards
Using Test View, users can identify how the testing activities relate to the ongoing sprints, cycles, or stories that are a part of the given project board.
- Test View - By Sprint
1. Allows users to see the iteration - sprints and the cycles that correspond under them with progress bars.
2. Clicking on a cycle will allow users to see test cases that are a part of that given cycle.
- Test View - By Issues
1. Allows users to see the flow from issue to issue - for example, an epic or a story that may relate to multiple test cases.
2. Clicking on a particular issue will show test cases that are covered by that aforesaid issue.

Copy All Test Steps between Test Issues
- Open the test case in edit mode
- Click on “...” then select ‘Copy Zephyr Test Steps’
| This opens the Copy Teststeps pag
- The source and its steps are selected for copy
- Select the destination tests using any of the below methods:
1. Individually - Enter the test issue's JIRA ID.
2. Via Search Filters - Enter Search Filter name and you can search for destination test issues
- Submit
Import Test Cases
Zephyr imports the test cases from Excel and XML files. This feature saves the browser load time while creating test cases directly in Zephyr.
Below are the steps to import your test cases from Excel:
- Go to the ‘Search Tests’ page
- Click on “...” then select ‘Import from CSV’
- Upload a CSV file for bulk create - click ‘Next’
- Select ‘Project’ - click ‘Next’
- Map JIRA and CSV fields
- Validate the bulk import and then click on the ‘Import’ button
Note: To import the detailed test steps, we need to use ‘Zephyr for JIRA Tests Importer Utility’.


Export Test Cases
- Via Search Page
- Go to ‘Search Tests’ page
- Select ‘Export to CSV’
- Via Test Cycle
- Go to ‘Cycle Summary’ page
- Select the required ‘Test Cycle’
- Right Click and select ‘Export’ option
Bulk Update
The bulk update feature saves effort and time by simultaneously updating multiple field values of selected (multiple) tests.
- Go to ‘Search Tests’ page
- Click on ‘...’ - Select ‘Bulk Change’


Organise Tests
- Go to ‘Test Summary’ page
- Tests are organized either by Project, Version (Fix version), Component or by Label.

Search Tests
- On selecting the ‘Search Tests’ menu option, you are taken to JIRA's Issue Navigator with the ‘Test’ issue-type pre-selected, thereby allowing you to search for tests.
- You can save the search filter for future use by clicking on ‘Save as’ link.

Search Test Execution
- We can search for the appropriate set of test executions using filters in Execution Navigator.
- We can switch to the Advanced mode :
1. The search box allows you to enter your search queries in the new Zephyr Query Language (ZQL).
2. ZQL is a simple structured query language that allows you to string together the right fields to search with values, using the appropriate operators and keywords.
For example, project = ABC AND executedStatus = FAIL

Automation
Consider, you are using continuous integration (CI) framework for automation. And you want to integrate it with ‘Zephyr for JIRA’, such that whenever test cases are executed in the CI framework, the test execution status is updated for the mapped tests in Zephyr.
Zephyr for JIRA provides you with this feature as part of ZAPI (or Zephyr API). ZAPI is an API that can be integrated with CI framework to update testing information in ‘Zephyr for Jira’ programmatically.
There are integrations available between Zephyr for Jira and the popular continuous integration tools
- Cucumber for JIRA
- SoapUI Pro
- TestComplete
- CrossBrowserTesting
- LoadNinja
- Bamboo
- Jenkins
How to integrate ZAPI and CI tool?
Assuming, there is an existing JIRA project and Zephyr is installed and configured.

- Install ZAPI Cloud add-on
- Generate an access and secret key
Click on Zephyr
Navigate to the Automation section and click on API Keys option.
Click on the Generate button
Copy both the access and secret key.


- Configure project on CI framework/automation tool
1. Create a project
2. Add a test cycle
3. Add test scripts to the created test cycle
- Also, add test cycle and test cases in Zephyr for JIRA
- Configure integration/binding between Zephyr for JIRA and CI framework using ZAPI keys and by mapping:
1. Project details
2. Version ID
3. Test cycles and Test cases
- Run the appropriate test scripts in the automation tool
- Test results will be updated for corresponding test cases in the Jira project.
- Metrics & Reports will reflect the results published.
Zephyr provides a suite of tools to optimize speed and quality of software testing, empowering us with the flexibility and visibility you need to achieve agility.

Zephyr for JIRA: Basics
Test management is the process of taking a project's requirements, building a test plan, writing the tests, planning the test activities and capturing the results. Test management tools that provide these capabilities, ease the testing process drastically. One such test management tool is Zephyr for JIRA.
Zephyr is an integrated plugin which provides the test management capabilities for projects in JIRA. Let's discover Zephyr for JIRA (cloud version) as a test management tool.
How to Integrate Zephyr with JIRA?
First, we need to install Zephyr for JIRA plugin and then add the issue type ‘test’ to the project.
- Log in as the Administrator on your JIRA Cloud instance
- Jira Settings - Find Apps/Add-ons - Search ‘Zephyr for JIRA’ - Install
- Project Settings - Issue Types - Add ‘Test’ type to project

Zephyr for Test Management
1. Creating a Test Cycle
A test cycle is a container for test cases. It allows the test cases to be grouped logically and executed in a structured fashion.
First, we need to create a test cycle using below steps:
- Click on Zephyr - ‘Cycle Summary’
- Click on the ‘+’ / ‘Create New Test Cycle’ button at the top of the folder menu
- Complete below fields to create a new test cycle:
- Version - Select applicable version of the project
- Name - Name of the test cycle
- Description - Description of the test cycle
- Build - Optional. Used to build details
- Environment - Environment on which test case is to be executed
- From - Start date of the test cycle
- To - End date of the test cycle
- Click on the ‘Save’ button
2. Creating Test
A test case is a set of actions executed to verify a particular feature or functionality of the software application. To create a test case in Zephyr, first, we need to create an issue with type ‘Test’ and then add test steps to it.
Step 1: Creating a Test
- Click on ‘+’ of the main menu
- Select the desired project under ‘Project’ dropdown
- Select ‘Test’ as an issue type
- Enter below details
Test Summary - Title of the test cases. Mandatory field.
Test Description - Description of the test case
Components - Select component specific to the project or feature
Fix Version - Select fix version/Release of the project
Priority - Select the priority of the test case
Assign To - Name of the user responsible for executing the test cases
Sprint - Sprint of the test case
Epic Link/Story links - Epic/Story ID for which test cases is been created
Attachments - Attach evidence/reference document
- Click on the ‘Create’ button
Step 2: Adding test steps to the Test
- Open the created test in edit mode
- Go to ‘Test Details’ section
- Add ‘Test Step’, ‘Test Data’ and ‘Expected Result’
- Test Detail Features -
Edit - Click on the cell - Modify - Click outside the cell
Clone - Click on the ‘Clone’ button available under the ‘Actions’ column
Delete - Click on ‘Delete’ button available under ‘Actions’ column
3. Adding Tests to Test Cycle
We can add tests to test cycle in two ways:
- From ‘Test Cycle Summary’ page
- Select the Test Cycle
- Click on the ‘Add Tests’ button
- Three ways to add tests:
Individually - Using Test ID
Via Search Filter - Using existing Search Filter
Another Cycle - Using Another test cycle
- Assign these tests by selecting a name under ‘Assign To’ dropdown
- Click on the ‘Save’ button
- From ‘Test Case View’ page
- Open the Test Case
- Click on ‘...’
- Select ‘Add to Test Cycle(s)’ option
3. Executing Tests
Test Execution is the process of executing the test cases in a test cycle and comparing the expected and actual results. After adding tests to the test cycle, we need to execute them. We can execute the test in Zephyr using either of the below ways:
- From ‘Test Cycle Summary’ page
- Select the ‘Test Cycle’
- Click on the ‘E’ button available against each test case
- This will open up the ‘Test Execution’ page for the respective test
- Fill in the ‘Pass/Fail’ details as applicable
- From ‘Test Case View’ page
- Open the Test Case
- Go to Test Execution section
- Click on the ‘E’ button available against each test case
- This will open up the Test Execution page for the respective test
- Fill in the details as applicable
4. Raising and Linking Bug
- Open the ‘Test Execution’ page of the failed test case
- Click on ‘Create New Issue’ button
- Fill in the details as applicable
Summary - Title of the bug
Reporter - User reporting the bug/issue
Description - Description of the bug (Steps to reproduce, Actual/Expected result)
Priority - Select Priority of the bug to get fixed
Linked Issues - Select test/issues related to this bug
Assign To - Select user who will work to fix this issue
- Save the issue
- New issue created will be linked to the test case
5. Tracking Testing Progress
There are several ways to track testing progress in Zephyr.
- Test Summary
The ‘Test Summary’ page gives an organized view of all the tests for a particular project, broken down by Versions, Components, and Labels.
- Traceability Matrix:
Traceability matrix provides the ability to map requirements to defects or vice-versa. Zephyr provides two traceability matrices:
1. Requirements to Defects: Generates full traceability report from Requirements - Tests - Test Executions - Defects.
2. Defects to Requirements: Generates full traceability report from Defects - Test Executions - Tests - Requirements.
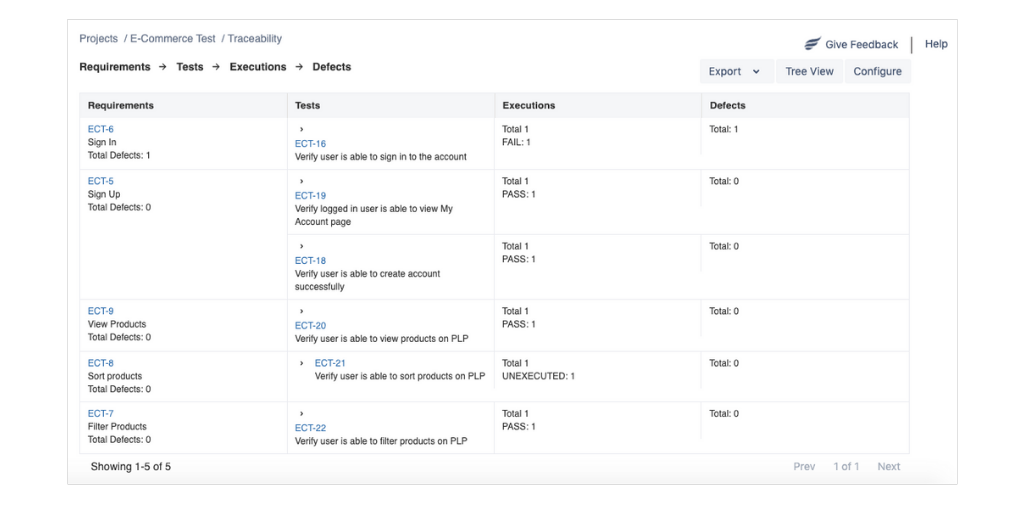
- Test Metrics
Zephyr automatically tracks below test metrics for the project/version:
- Daily Test Execution Progress, by status
- Test Executions by Test Cycle
- Test Executions by Tester
- Execution List
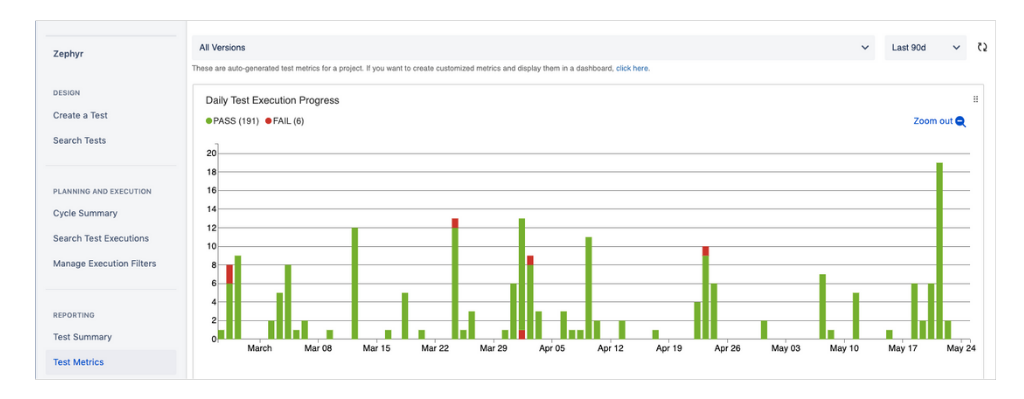
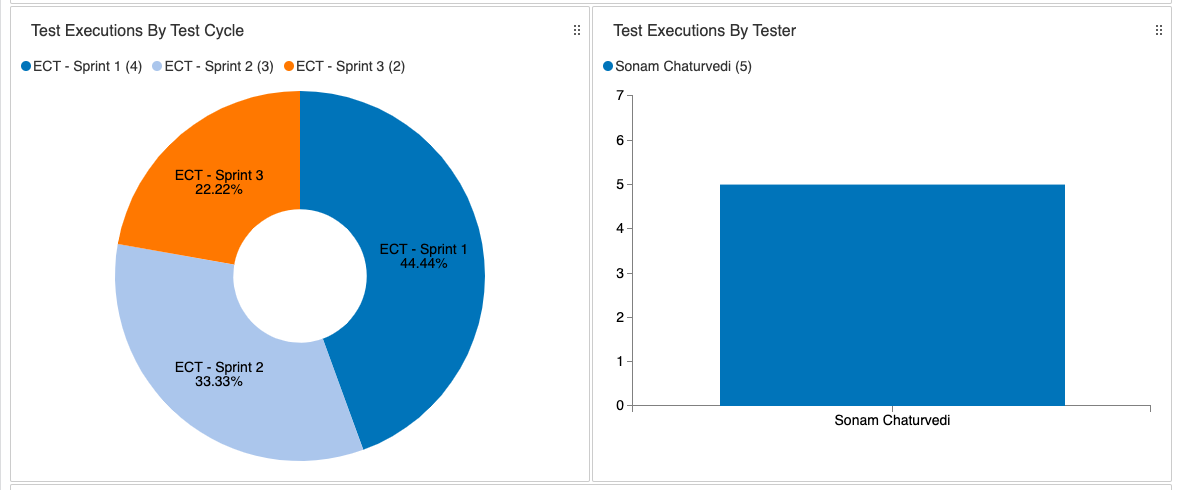
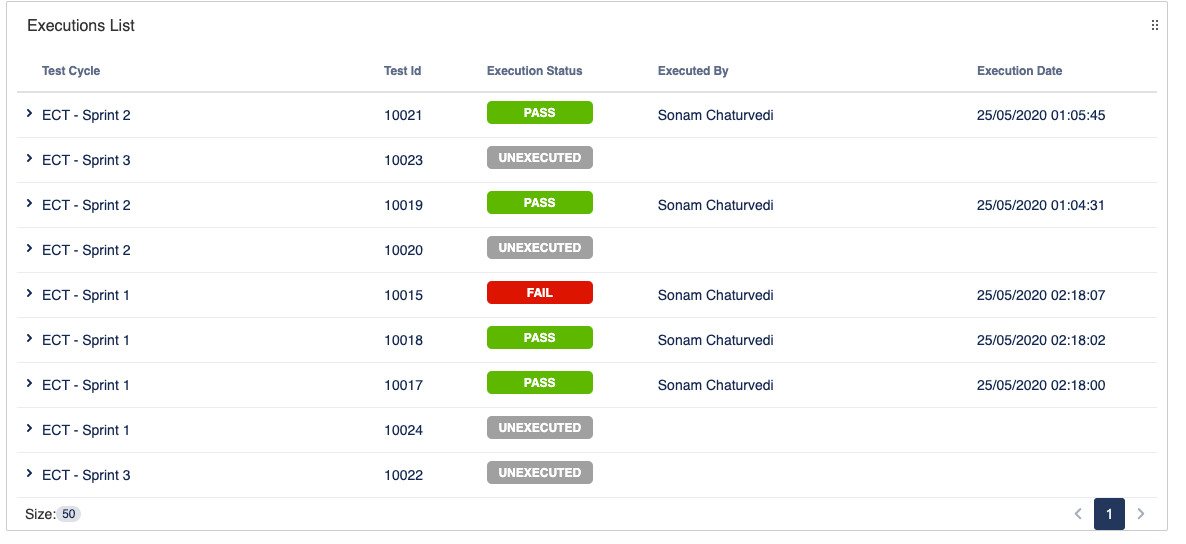
Pros and Cons of Zephyr
Pros:
- Better traceability with the linkage between stories, test cases and bugs in the test cycles.
- Graphical representation of the results.
- UI look and feel is the same as JIRA’s
- Test cases can be exported to word, excel formats.
- Test case review process possible through Agile Board.
- Multiple test iterations with multiple cycles can be created.
- Possible to create customized filters.
Cons:
- Importing existing test cases from excel is not easy and one has to use some external add-on for that.
- Test Case writing in Zephyr (browser) compared to the Excel sheet is tedious.
- Test result import not possible.
- Does not integrate with other applications such as Rally or TFS
Thanks for reading! Hope this gives you an overview of how to integrate Zephyr with JIRA and use test management capabilities in any JIRA project. Part 2 of this blog series Zephyr for JIRA: Features explores some quick and handy features of Zephyr. Stay tuned!

Cypress Automation for e-commerce site
The e-commerce wave of conducting business online is growing day by day. And with that, delivering the best user experience is their utmost priority. Our team recently developed a Decoupled e-commerce site - 'Shop the Area' powered by Drupal as its backend and Gatsby as frontend. The website carries several independent boutiques. The user can buy products from the boutiques which are within their 15-mile radius. Since an e-commerce site demands numerous functional and end to end tests, automating this was cumbersome. So, we decided to implement Cypress for automating the testing process for our e-commerce site.
Cypress
Cypress is an end to end JS-based web-testing framework which is an excellent tool for an end to end testing, resulting in easy implementation of Functional test scenarios in websites. Cypress is easy to understand and adopt. It has an awesome GUI, runs on the browser, Automatic waits, fast response, easy debugging etc.
Installing Cypress
I installed Cypress using npm, the npm must be pre-installed in the system. Then, create a project folder, set this folder as the root folder in the terminal and install Cypress using the code given below.
1. Download Cypress
2. Mention base URL pointing at the domain which we are going to test in cypress.json file. Since we are referring to ‘Shop the area’ website, I will enter “https://shopthearea.netlify.app/”. We can also set viewport in which we want to test.
3. So let's try out a simple test script. Create a .js file in the integration folder Write a scenario that needs to be tested.
For example in our site, I create header.js script to check the menu link and their landing page in the header.
Spec file: Header.js
Since I have implemented POM in my tests, I have created a function for pointing on to the menu and a JSON file for storing user data like the URLs for this test.
Let’s import these 2 files in the test file.
POM file: header.js
Data file: header.json
4. Open the GUI through the terminal.
5. Run test
.gif)
Test Organisation
Organising the Test folder is essential for easy maintenance.
- Test files are in cypress/integration under the Spec folder. The execution test scripts are created here.
- POM files are in the Page folder. POM enables us to write the tests using objects that are relevant to the application; limit the use of selectors and other page-specific code, making the test code clean and easy to understand
- User data in Data folder. Static data can be stored in this folder.
To understand the structure to the image below.
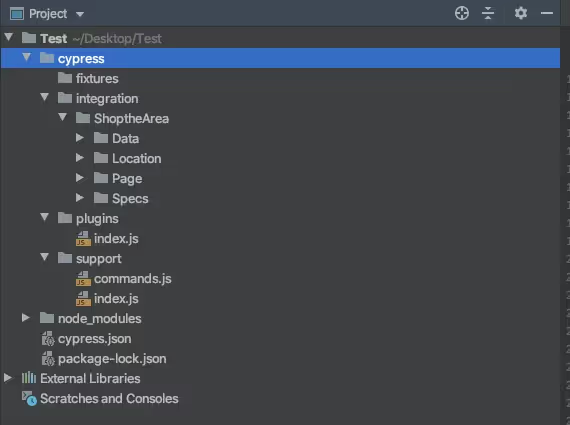
Functional testing can be done for the following using Cypress:
- Homepage components - Testing header, footer
- Listing pages such as product listing, boutiques listing pages
- Detail pages like - Boutique detail pages, product detail pages
- Login page, Sign up page
- Cart and checkout pages
- End to End test of buying products
Example scripts
Feature: Verify Cart
Test scenarios example:
- Adding a product to the cart, checking the components of a product in the cart such as image, name, quantity widgets.
- Check removal of products from the cart.
- Check for an empty message when all the products are removed
Since this website has a location feature, the script includes setting location before each test section.
Spec File: Cart.js
POM file:cart.js
.gif)
Feature: Search Functionality
Example Scenarios:
- To check if products are displayed when the user enters a keyword in the Search field, and check if the search keyword is displayed in the search field on the result page.
- To check “No product found” message is displayed when the user enters a random keyword in the Search field.
- To check if the drop-down of the search field displays suggestions related to the searched keyword
Spec File: search.js
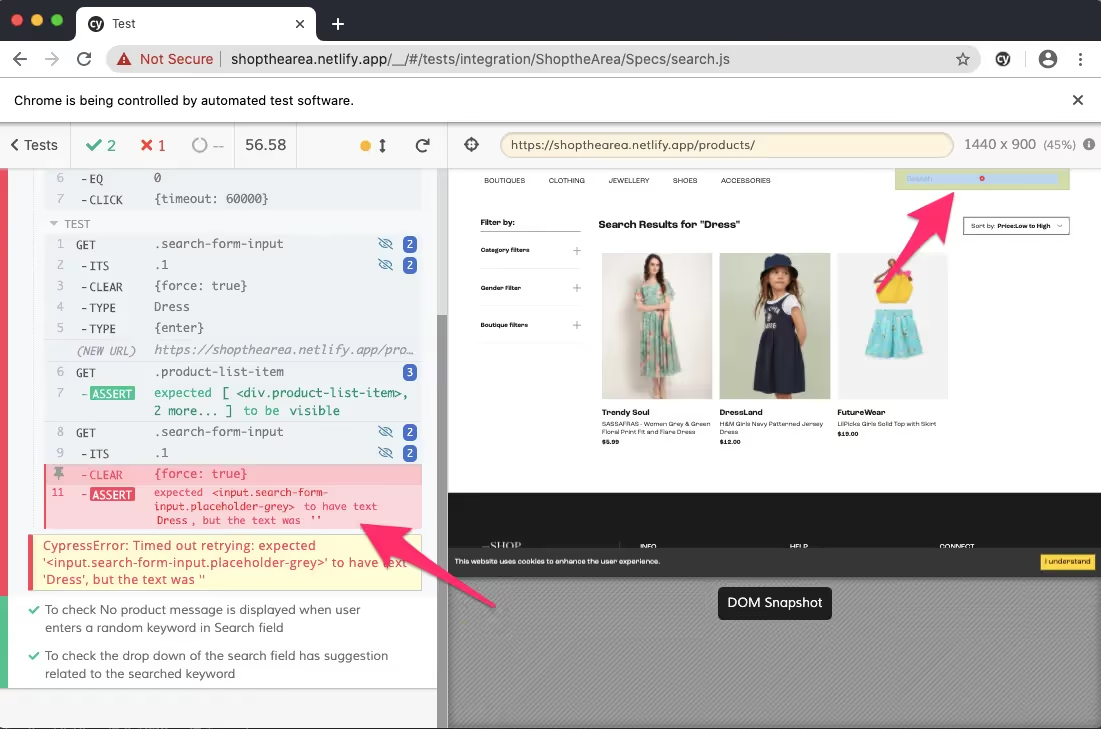
In the first scenario, the search term display in the search field of the result page failed, this is clearly highlighted in the Cypress test runs. This feature is helpful in debugging such issues.
Conclusion
Cypress test runner is fast and easy to write-run end-to-end tests. Cypress has numerous plus points like easy debugging, simple cypress GUI, automatic waits, supports different browsers, saves screenshots and videos, consistent tests, etc. All these features make it a user-friendly testing tool.
Few points to be kept in mind while automating an e-commerce website:
- Decide on Test scenarios which can be automated, or needs automation.
- Think of implementing test cases with inbuilt functions and use minimum coding.
- Maintain organised Test folder structure and naming conventions. This helps avoid confusion. For starters, the POM model can be followed.
- Since Cypress mainly detects elements using selectors. Get accustomed to identifying CSS, Xpath selectors of elements. This will save a lot of time in implementations of tests.
- Sometimes elements are missed out in automatic waits. This issue can be solved by applying timeouts, implicit waits for the element.
Happy Testing :)

Apply Smoke, Sanity, and Regression testing the right way.
It is always a challenging part to decide which type of testing is to be done at the end of a sprint or at the end of a project. Mostly it’s being misunderstood and we often end up using the wrong one or we don’t follow the right naming convention for the testing that we usually do.
For example, on some of the projects, we spend a day or two to perform entire application testing at the end of the sprint. And we label it as Smoke testing. This is not right! This should be identified as Regression testing.
How to decide which type of testing is to be done?
At the end of the sprint, we should mostly perform Smoke/Sanity testing based upon the deadline.
If you don’t have enough time to opt for Smoke testing or else perform the sanity checks. When you have an ample amount of time in your hands, Regression testing is the last option.
So the preferences should be like Smoke testing, Sanity testing, and then Regression testing as per the project deadline.
Consider an example for this, suppose we have 50 functional components. Out of them, 10 are major components and let’s say remaining components revolve around them.
Then as a part of Smoke Testing, we should quickly verify the major 10 components.
As a part of Sanity testing, we should verify all the components.
And in Regression testing, we should verify the complete system (all components) and bugs too.
What groundwork must a QA do?
Timeboxing the activity and sharing an ETA
Based on the selected testing approach share an ETA with the respective Project Managers or Leads and get it approved
Documentations
Depending upon the above example, QAs should be ready with the following documentation for each testing phase:
- Smoke testing: List of features
- Sanity testing: List of the core functionalities with the highly impacted areas
- Regression: List of all the functionalities along with detailed test cases and bugs with the detailed descriptions.
Tracking test cycles
We should document all results of these testing for future references. For documenting the results we should use a Spreadsheet or any other test case management tool.
Tracking the results is the most important part of Smoke, Sanity, and Regression testing. After testing, we should analyze the present result with the previous results. This helps us in understanding the root cause of the issues occurring and tracking issues in an easier way.
We should always try to understand the difference and importance of all these three types of testing and try to explain the same to other project members so that we can collaboratively build a good process around implementing each one of this on the project.
.avif "How can Quality Assurance Engineers truly own their projects?")
How can Quality Assurance Engineers truly own their projects?
Often Quality Assurance Engineers focus only on the testing responsibilities assigned to them. And that’s what our job profile is, after all. However, to excel at our jobs we need to walk the extra mile. We need to go beyond just writing test cases and scenarios. We need to take ownership of the project!
Here are some ways in which a QA can exhibit their ownership skills:
- Documentation for new experiments: If you are doing anything for the first time would it be a setup, POCs, configuration, etc. parallelly create a document with the steps followed and how you were able to achieve the particular task. Share this document with your team lead, get it reviewed and then share it with the entire team.
- Continuous improvements: Do not blindly follow the existing test templates of your project. For example, test plan template, test cases, acceptance criteria, regression test suite, bug reporting template, checklists for some common features, etc. Always share ideas and improvements around updating these existing templates.
- Creating test suites: Always ask for a regression test suite, sanity checks or smoke test scenarios. If these are not already present or created, start writing your own and also introduce them to the entire team. Start using these suites for your test cycles and share the results with the team at the end of the test cycle.
- Sharing meeting updates: Creating meeting notes and sharing with the team is a good practice. This is very helpful and appreciated when you are a part of lengthy meetings. At the end of the meeting, having a list of all points discussed and sharing these points with other team members helps them recollect.
- Feature ownership: Start taking ownership of features if multiple QAs are working on a project. For example, let’s say if any new feature such as “Checkout functionality” is in progress, you should work on its backend, frontend and all related tasks. You can always ask your Project Manager to allow you to do so.
Advantages of doing so:
- You can create test scenarios for this feature.
- Time utilisation - since both backend and front end tickets will be tested by you, this saves time and avoids repetition.
- Preparing a feature demo for the entire team.
- Automating this feature (if needed or told to).
- Possess knowledge of the entire feature flow.
- Share Knowledge: Always share your learnings from past projects with your team members. If you have experience of working on a related feature or technology, your prior knowledge might just save your colleagues some trial and error. For example, during sprint planning, you can come up with the edged scenarios or negative scenarios which are mostly missed by devs. This can help to reduce efforts.
- Utilise spare time: If you are running out of tickets, please do not wait for someone to assign tickets. Proactively, keep on checking the tickets that are in the development phase and going to be assigned for QA or the backlog tickets. Utilise this time for writing test cases, automation scripts or anything that will be helpful in reducing efforts.
Happy Testing!

Three Burning Questions Every Quality Assurance Engineer Would Ask
Our job as Quality Assurance engineers is to test websites and applications before they are delivered, improving the user experience for a seamless experience across all platforms. It is imperative that the quality assurance and testing services blend seamlessly into the development life cycle delivering error-free and high performing web, cloud, and mobile apps.
Previously I have been sharing some QA tips that will make your work better, faster and easier. This time, I would like to answer a couple of questions that every QA might come across in their careers:
Question 1: What knowledge is needed to be an excellent or proficient QA?
In my opinion, as a QA one should have:
- Project knowledge - QAs should be aware of everything happening on a project such as what is the timeline, who is working on what part of the project, project complexity, deliverables, etc.
- Product knowledge - How does the product work and what is the main purpose of it.
- Technical stack - QAs should be aware of what technical stack is being used in the project. Which technologies can be used in QA
- Project history knowledge - What problems have occurred in the past which can be avoided now, anything else that can be useful as learning, etc.
- Market knowledge - Complete understanding of the target audience; who is going to use the product? who are our competitors? studying similar products in the market.
- Testing Techniques knowledge - One should be aware of what are the various testing techniques and should be capable enough to choose an appropriate one whenever and wherever required.
- Testing tools knowledge - Knowledge about tools that will ease up the process of testing (these can be any tools).
Question 2: Can we perform automation within the sprint? Answer to this is, Yes!
Let's go through different basic strategies which will help you achieve this:
- Working with developers and other stakeholders from the beginning of the project (Set up the code on the machine, start writing the automation code along with the project code in parallel, and lastly, configure CI/CD).
- Setting up a priority for which features should be automated or which features need automation from a business perspective and focus only on these features. APIs should be automated. Other tests such as UI tests can be done manually or later if not possible within the sprint.
- Follow the BDD automation approach wherever necessary.
- User stories are available when the sprint starts, so I believe testers can start developing the temporary code structure from this, such as code steps and later on, they can add the actual values for these steps (XPath, ids, CSS, etc.) and can also later add validation checks and edge cases.
Question 3: How to start a career in automation?
Many a time I come across people with queries such as:
- I have got 4-5years of experience (this is just an example) in testing but never practised automation testing.
- I have theoretical knowledge but don't have practical knowledge
- I did not get a chance to work on automation as there were no requirements etc.
Well, in my opinion, it's not too late to start now! It's not that difficult to start working on automating your use cases or scenarios.
- If you are confused and don't know where to start from, here are some of my observations that might help:
- Start learning and practising a single language and try to learn the concepts starting from basic to advance. You are always open to choose this as per your convenience. For example JAVA, PHP, etc.
- Spend at least 20-30mins daily on this assignment. Gaps in learning will always require a lot of efforts to restart from the beginning.
- If possible please do attend some framework development courses. This will help understand how the automation project works.
Ask your current organisation to make you part of an automation project. If this is not possible you can do the following things:
- Keep checking with the Automation QAs in your organisation around the work they do. Keep on asking them questions and try understanding the process. Work on some small assignments together.
- Work on open source automation projects.
- Even if you develop a small piece of code for any of the features or project, or during the learning phase, save this piece of code with proper structuring and documentation so you can reuse it later. Keep in mind "Every piece of code should be written in such a format that it should be reusable"
- Don't wait for someone to train you, or teach you. You can always self-learn or ‘you can Google it’! I am sure you will find all your answers there.
- Apart from this, you can join online communities for automation on Slack, LinkedIn, etc where you can always post your queries.
- Hands-on practice is a must! Just reading tutorials, going through videos won't help. Just like buying a dress after you try it on!
Happy Testing :)

Embracing the Data-Driven QA Approach
Before we delve deeper in the how’s and why’s let us understand what Data-Driven Analytics reports are?
These reports help identify:
- How our web or mobile application are performing.
- Which web pages or features are most visited.
- Which OS, browsers, devices, and screen resolution are frequently used.
- Bounce rate statistics
- Site transactions and revenue analysis for E-commerce sites.
- From which location the site is accessible
- Acquisition details which give an idea of where the site visitors originated from such as Google Ads, search engines, or through social networking sites.
Why should a QA participate?
This will help in planning the testing activities where QAs will have a clear understanding of:
- Pages and features to be focused on more during testing.
- Which OS, browsers, devices and screen resolutions to be focused on more during testing.
- If there are any pages reported for poor performances then setting up a performance test for these pages.
- Focusing around social sharing options testing on-site.
- Finding out reasons for bounce rates (this can be due to images not loading, poor fonts used for content on the homepage, etc.)
- For an E-Commerce site, we can check if the user was able to place an order and carry out the payment without any error.
Challenges
1. Will be useful only when the 1st version is released in the market. Analytical data will be generated only when the web application is live.
2. Setting up analytics tool for project and it's licensing.
Example
Setting up Google Analytics for a project and analyzing the reports generated and then based on it updating the test activities.
Therefore, it is very important to understand 'What' and 'How' your users are doing on your website.
Happy Testing!